O'Reilly Auto Parts 2003 Annual Report Download - page 9
Download and view the complete annual report
Please find page 9 of the 2003 O'Reilly Auto Parts annual report below. You can navigate through the pages in the report by either clicking on the pages listed below, or by using the keyword search tool below to find specific information within the annual report.-
 1
1 -
 2
2 -
 3
3 -
 4
4 -
 5
5 -
 6
6 -
 7
7 -
 8
8 -
 9
9 -
 10
10 -
 11
11 -
 12
12 -
 13
13 -
 14
14 -
 15
15 -
 16
16 -
 17
17 -
 18
18 -
 19
19 -
 20
20 -
21
-
22
-
23
-
24
-
25
-
26
-
27
-
28
-
29
-
30
-
31
-
32
-
33
-
34
-
35
-
36
-
37
-
38
-
39
-
40
-
41
-
42
-
43
-
44
-
45
-
46
-
47
-
48
-
49
-
50
-
51
-
52
-
53
-
54
-
55
-
56
-
57
-
58
-
59
-
60
 |
 |

page 7
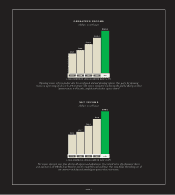
Net income represents more than sales less all expenses and adjustments. It’s a critical metric of performance that is
near and dear to all O’Reilly Team Members and the reward for a job well-done. Our team knows that taking care of
our customers each day and watching our pennies drives net income.
2003200220012000
1999
$100.1
$82.0
$66.4
$51.7
$45.6
net income
(dollars in millions)
Operating income refers to product sales, less cost of goods sold and operating expenses. Our goal is for operating
income, as a percentage of sales, to be 11% or greater. Our team is committed to achieving this goal by offering excellent
customer service to drive sales, coupled with relentless expense control.
2003200220012000
1999
$165.3
$138.3
$113.8
$90.0
$76.9
operating income
(dollars in millions)
5-year compound annual growth rate: 23.8%
5-year compound annual growth rate: 26.6%