O'Reilly Auto Parts 2003 Annual Report Download - page 8
Download and view the complete annual report
Please find page 8 of the 2003 O'Reilly Auto Parts annual report below. You can navigate through the pages in the report by either clicking on the pages listed below, or by using the keyword search tool below to find specific information within the annual report.-
 1
1 -
 2
2 -
 3
3 -
 4
4 -
 5
5 -
 6
6 -
 7
7 -
 8
8 -
 9
9 -
 10
10 -
 11
11 -
 12
12 -
 13
13 -
 14
14 -
 15
15 -
 16
16 -
 17
17 -
 18
18 -
 19
19 -
20
-
21
-
22
-
23
-
24
-
25
-
26
-
27
-
28
-
29
-
30
-
31
-
32
-
33
-
34
-
35
-
36
-
37
-
38
-
39
-
40
-
41
-
42
-
43
-
44
-
45
-
46
-
47
-
48
-
49
-
50
-
51
-
52
-
53
-
54
-
55
-
56
-
57
-
58
-
59
-
60
 |
 |

page 6
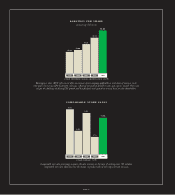
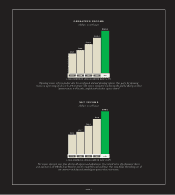
Earnings per share (EPS) refers to net after-tax income of our company applicable to each share of common stock.
Our goal is to increase EPS by 18-20% each year, reflecting our goals of growth in sales and expense control. Our team
accepts the challenge of driving EPS growth and benefits from such growth as most of them are also shareholders.
2003200220012000
1999
$1.84
$1.53
$1.26
$1.00
$0.92
earnings per share
(assuming dilution)
5-year compound annual growth rate: 21.0%
5-year average: 7.0%
Comparable store sales percentage measures the sales increases or decreases of existing stores. We calculate
comparable store sales data based on the change in product sales of stores open at least one year.
2003200220012000
1999
7.8%
3.7%
8.8%
5.0%
9.6%
comparable store sales