O'Reilly Auto Parts 2002 Annual Report Download - page 5
Download and view the complete annual report
Please find page 5 of the 2002 O'Reilly Auto Parts annual report below. You can navigate through the pages in the report by either clicking on the pages listed below, or by using the keyword search tool below to find specific information within the annual report.-
 1
1 -
 2
2 -
 3
3 -
 4
4 -
 5
5 -
 6
6 -
 7
7 -
 8
8 -
 9
9 -
 10
10 -
 11
11 -
 12
12 -
 13
13 -
 14
14 -
 15
15 -
 16
16 -
17
-
18
-
19
-
20
-
21
-
22
-
23
-
24
-
25
-
26
-
27
-
28
-
29
-
30
-
31
-
32
-
33
-
34
-
35
-
36
-
37
-
38
-
39
-
40
-
41
-
42
-
43
-
44
-
45
-
46
-
47
-
48
-
49
-
50
-
51
-
52
-
53
-
54
-
55
-
56
 |
 |

2002 Annual Report 3
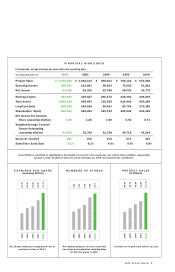
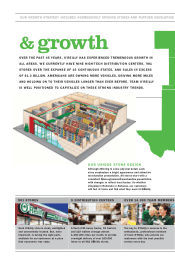
We continue adding to our store count with
new stores and acquisitions, including plans
for 130 new stores in 2003.
Our plans are to grow sales 18-20% per year.Our 10-year compound average growth rate in
earnings per share is 21.4%
1998
1999
2000
2001
2002
$0.71
$0.92
$1.00
$1.26
$1.53
1998
1999
2000
2001
2002
491
571
672
875
981
1998
1999
2000
2001
2002
$0.62
$0.75
$0.89
$1.09
$1.31
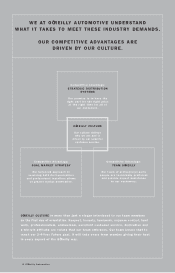
Team O'Reilly is committed to capitalizing on the demand for auto parts and accessories. Our 2-4-Your Future initiative, representing
our goal to reach $2 billion in sales per year by December 31, 2005, demonstrates this commitment.
FINANCIAL HIGHLIGHTS
In thousands, except earnings per share data and operating data
Year ended December 31 2002 2001 2000 1999 1998
Product Sales $1,312,490 $1,092,112 $ 890,421 $ 754,122 $ 616,302
Operating Income 138,301 113,831 90,029 76,920 56,901
Net Income 81,992 66,352 51,708 45,639 30,772
Working Capital 483,623 429,527 296,272 249,351 208,363
Total Assets 1,009,419 856,859 715,995 610,442 493,288
Long-Term Debt 190,470 165,618 90,463 90,704 170,166
Shareholders' Equity 650,524 556,291 463,731 403,044 218,394
Net Income Per Common
Share (assuming dilution) 1.53 1.26 1.00 0.92 0.71
Weighted-Average Common
Shares Outstanding
(assuming dilution) 53,692 52,786 51,728 49,715 43,204
Stores At Year-End 981 875 672 571 491
Same-Store Sales Gain 3.1% 8.2% 4.0% 9.6% 6.8%
EARNINGS PER SHARE
(assuming dilution) PRODUCT SALES
(in billions)
NUMBERS OF STORES