North Face 1999 Annual Report Download - page 32
Download and view the complete annual report
Please find page 32 of the 1999 North Face annual report below. You can navigate through the pages in the report by either clicking on the pages listed below, or by using the keyword search tool below to find specific information within the annual report.-
 1
1 -
2
-
3
-
4
-
5
-
6
-
7
-
8
-
9
-
10
-
11
-
12
-
13
-
14
-
15
-
16
-
17
-
18
-
19
-
20
-
21
-
 22
22 -
 23
23 -
 24
24 -
 25
25 -
 26
26 -
 27
27 -
 28
28 -
 29
29 -
 30
30 -
 31
31 -
 32
32 -
 33
33 -
 34
34 -
 35
35 -
 36
36 -
 37
37 -
 38
38 -
 39
39 -
 40
40
 |
 |

[30]
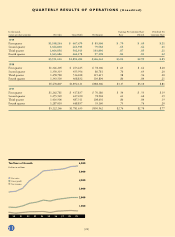
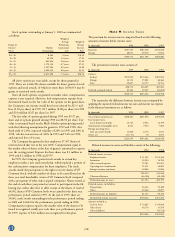
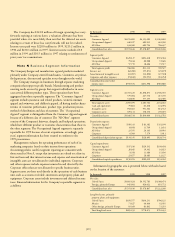
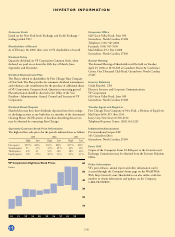
Worldwide sales by product category are as follows:
In thousands 1999 1998 1997
Jeanswear and related products $2,936,196 $2,962,790 $2,888,967
Intimate apparel 981,798 965,782 648,937
Occupational apparel 640,227 482,931 461,940
Knitwear 453,103 506,365 614,798
Other 540,292 560,939 607,604
Total $5,551,616 $5,478,807 $5,222,246
Sales to one domestic discount store group comprise 13.0% of
consolidated sales in 1999, 12.3% in 1998 and 11.1% in 1997.
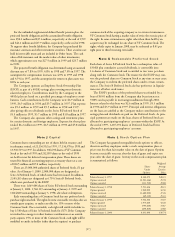
Note O Leases
The Company leases certain facilities and equipment under
noncancelable operating leases. Rental expense was $59.3 million
in 1999, $64.3 million in 1998 and $66.2 million in 1997. Future
minimum lease payments are $54.7 million, $44.2 million,
$35.3 million, $28.0 million and $20.4 million for the years 2000
through 2004 and $43.1 million thereafter.
Note P Earnings Per Share
In thousands, except per share amounts 1999 1998 1997
Basic earnings per share:
Net income $366,242 $388,306 $350,942
Less Preferred Stock dividends
and redemption premium 6,394 5,912 5,003
Net income available for
Common Stock $359,848 $382,394 $345,939
Weighted average Common
Stock outstanding 118,538 120,744 125,504
Basic earnings per share $ 3.04 $ 3.17 $ 2.76
Diluted earnings per share:
Net income $366,242 $388,306 $350,942
Increased ESOP expense if
Preferred Stock were converted
to Common Stock 1,036 1,136 1,227
Net income available for
Common Stock and dilutive
securities $365,206 $387,170 $349,715
Weighted average Common
Stock outstanding 118,538 120,744 125,504
Additional Common Stock
resulting from dilutive securities:
Preferred Stock 2,724 2,854 2,955
Stock options and other 996 1,397 1,261
Weighted average Common
Stock and dilutive securities
outstanding 122,258 124,995 129,720
Diluted earnings per share $ 2.99 $ 3.10 $ 2.70
Outstanding options to purchase 2.1 million shares of Common
Stock have been excluded from the computation of diluted earnings
per share in 1999 because the option exercise prices were greater
than the average market price of the Common Stock.
Note Q Financial Instruments
The carrying amount and fair value of financial instruments included
in the balance sheets are as follows:
In thousands 1999 1998
Carrying Fair Carrying Fair
Amount Value Amount Value
Financial liabilities:
Short-term borrowings $408,932 $408,932 $244,910 $244,910
Long-term debt 522,585 507,297 522,626 552,476
Series B Preferred Stock 51,544 80,133 54,344 132,008
The fair value of the Company’s short-term and long-term debt is
estimated based on quoted market prices or values of comparable
borrowings. The fair value of the Series B Preferred Stock is based on
a valuation by an independent financial consulting firm.
The Company enters into short-term foreign currency forward
exchange contracts to manage exposures related to specific foreign
currency transactions or anticipated cash flows. Changes in the fair
values of these contracts are recognized currently in operating
income. The amounts of the contracts, and related gains and losses,
are not material. The fair value of foreign currency financial
instruments approximates their carrying value.