North Face 1999 Annual Report Download - page 31
Download and view the complete annual report
Please find page 31 of the 1999 North Face annual report below. You can navigate through the pages in the report by either clicking on the pages listed below, or by using the keyword search tool below to find specific information within the annual report.-
 1
1 -
2
-
3
-
4
-
5
-
6
-
7
-
8
-
9
-
10
-
11
-
12
-
13
-
14
-
15
-
16
-
17
-
18
-
19
-
20
-
 21
21 -
 22
22 -
 23
23 -
 24
24 -
 25
25 -
 26
26 -
 27
27 -
 28
28 -
 29
29 -
 30
30 -
 31
31 -
 32
32 -
 33
33 -
 34
34 -
 35
35 -
 36
36 -
 37
37 -
 38
38 -
 39
39 -
 40
40
 |
 |

[29]
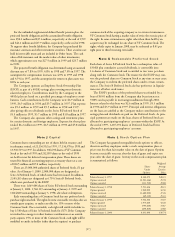
The Company has $141.8 million of foreign operating loss carry-
forwards expiring at various dates; a valuation allowance has been
provided where it is more likely than not that the deferred tax assets
relating to certain of those loss carryforwards will not be realized.
Income taxes paid were $228.0 million in 1999, $215.2 million in
1998 and $230.1 million in 1997. Interest income includes $3.0
million in 1999 and $10.5 million in 1997 relating to settlements of
prior years’ tax examinations.
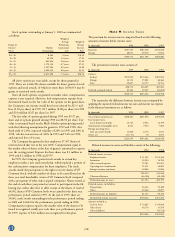
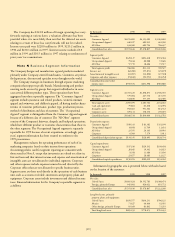
Note N Business Segment Information
The Company designs and manufactures apparel products marketed
primarily under Company-owned brand names. Customers are primar-
ily department, discount and specialty stores throughout the world.
The Company manages its businesses through separate marketing
companies that support specific brands. Manufacturing and product
sourcing needs are met by groups that support individual or in some
cases several different product types. These operations have been
aggregated into three reportable segments. The “Consumer Apparel”
segment includes jeanswear and related products, women’s intimate
apparel and swimwear, and children’s apparel, all having similar charac-
teristics of economic performance, product type, production process,
method of distribution and class of customer. The “Occupational
Apparel” segment is distinguished from the Consumer Apparel segment
because of a different class of customer. The “All Other” segment
consists of the Company’s knitwear, daypack and backpack operations,
which have different product or economic characteristics than those in
the other segments. The Occupational Apparel segment is separately
reportable for 1999 because of recent acquisitions; accordingly, prior
years’ segment information has been restated to conform to the
1999 presentation.
Management evaluates the operating performance of each of its
marketing companies based on their income from operations.
Accounting policies used for segment reporting are consistent with
those stated in Note A, except that inventories are valued on a first-in,
first-out basis and that interest income and expense and amortization of
intangible assets are not allocated to individual segments. Corporate
and other expenses include expenses incurred in and directed by the
Corporate offices that are not allocated to specific business units.
Segment assets are those used directly in the operations of each business
unit, such as accounts receivable, inventories and property, plant and
equipment. Corporate assets include investments and deferred income
taxes. Financial information for the Company’s reportable segments is
as follows:
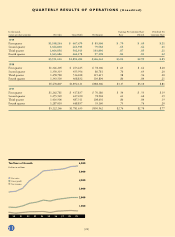
In thousands 1999 1998 1997
Net sales:
Consumer Apparel $4,276,809 $4,313,082 $3,963,869
Occupational Apparel 640,227 482,931 461,940
All Other 634,580 682,794 796,437
Consolidated net sales $5,551,616 $5,478,807 $5,222,246
Segment profit:
Consumer Apparel $629,127 $693,638 $574,384
Occupational Apparel 79,164 80,988 72,626
All Other 57,715 38,686 73,517
Total segment profit 766,006 813,312 720,527
Interest, net (62,490) (55,871) (25,877)
Amortization of intangible assets (33,097) (32,890) (27,518)
Corporate and other expenses (74,843) (92,953) (81,252)
Consolidated income before
income taxes $595,576 $631,598 $585,880
Segment assets:
Consumer Apparel $1,783,225 $1,858,873 $1,506,035
Occupational Apparel 379,004 247,734 217,239
All Other 332,850 377,155 421,389
Total segment assets 2,495,079 2,483,762 2,144,663
Cash and equivalents 79,861 63,208 124,094
Intangible assets 992,463 951,562 814,332
Corporate assets 459,111 338,134 239,693
Consolidated assets $4,026,514 $3,836,666 $3,322,782
Depreciation expense:
Consumer Apparel $ 89,313 $ 83,382 $ 81,199
Occupational Apparel 14,958 11,769 11,631
All Other 23,555 26,165 29,993
Corporate 6,509 7,179 5,911
Consolidated depreciation expense $134,335 $128,495 $128,734
Capital expenditures:
Consumer Apparel $ 97,196 $129,532 $109,458
Occupational Apparel 20,845 19,362 16,821
All Other 8,358 11,480 15,856
Corporate 23,677 28,685 12,127
Consolidated capital expenditures $150,076 $189,059 $154,262
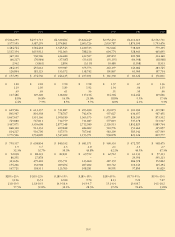
Information by geographic area is presented below, with sales based
on the location of the customer:
In thousands 1999 1998 1997
Net sales:
United States $4,605,624 $4,552,785 $4,368,474
Foreign, primarily Europe 945,992 926,022 853,772
Consolidated net sales $5,551,616 $5,478,807 $5,222,246
Long-lived assets, primarily
property, plant and equipment:
United States $650,577 $634,231 $596,125
Mexico 71,627 60,400 41,055
Other foreign, primarily Europe 83,029 83,842 73,253
Total long-lived assets $805,233 $778,473 $710,433