Nintendo 2015 Annual Report Download - page 8
Download and view the complete annual report
Please find page 8 of the 2015 Nintendo annual report below. You can navigate through the pages in the report by either clicking on the pages listed below, or by using the keyword search tool below to find specific information within the annual report.-
 1
1 -
 2
2 -
 3
3 -
 4
4 -
 5
5 -
 6
6 -
 7
7 -
 8
8 -
 9
9 -
 10
10 -
 11
11 -
 12
12 -
 13
13 -
 14
14 -
 15
15 -
 16
16 -
 17
17 -
 18
18 -
 19
19 -
20
-
21
-
22
-
23
-
24
-
25
-
26
-
27
-
28
-
29
-
30
-
31
-
32
-
33
-
34
-
35
-
36
-
37
-
38
-
39
-
40
-
41
-
42
-
43
-
44
-
45
-
46
-
47
-
48
-
49
-
50
-
51
 |
 |
- 6 -
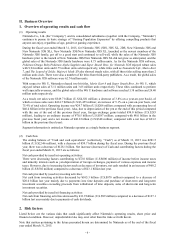
II. Business Overview
1. Overview of operating results and cash flow
(1) Operating results
Nintendo Co., Ltd. (the“ Company”) and its consolidated subsidiaries (together with the Company, “Nintendo”)
continues to pursue its basic strategy of “Gaming Population Expansion” by offering compelling products that
anyone can enjoy, regardless of age, gender or gaming experience.
During the fiscal year ended March 31, 2015, for Nintendo 3DS (3DS, 3DS XL, 2DS, New Nintendo 3DS and
New Nintendo 3DS XL), New Nintendo 3DS/New Nintendo 3DS XL, launched as the newest members of the
Nintendo 3DS family, got off to a good start and continued to sell well, while the sales of the Nintendo 3DS
hardware prior to the launch of New Nintendo 3DS/New Nintendo 3DS XL did not grow as anticipated, and the
global sales of the Nintendo 3DS family hardware were 8.73 million units. As for the Nintendo 3DS software,
Pokémon Omega Ruby/Pokémon Alpha Sapphire and Super Smash Bros. for Nintendo 3DS enjoyed robust sales
with 9.94 million units and 6.75 million units sold respectively, while titles such as Tomodachi Life, Mario Kart
7, and The Legend of Zelda: Majora’s Mask 3D also showed steady sales, with all three titles selling more than 2
million units each. There were also a number of hit titles from third-party publishers. As a result, the global sales
of the Nintendo 3DS software were 62.74 million units.
With respect to Wii U, Nintendo released two hit titles, Mario Kart 8 and Super Smash Bros. for Wii U, which
enjoyed robust sales of 5.11 million units and 3.65 million units respectively. These titles continued to perform
well especially overseas, and the global sales of the Wii U hardware and software reached 3.38 million and 24.40
million units respectively.
As a result, net sales were ¥549.7 billion (U.S.$4,581 million; a decrease of 3.8% on a year-on-year basis), of
which overseas sales were ¥414.7 billion (U.S.$3,455 million; an increase of 5.1% on a year-on-year basis, and
75.4% of total sales). Operating income was ¥24.7 billion (U.S.$206 million; compared with an operating loss of
¥46.4 billion in the previous fiscal year). Also, due to depreciation of the yen at the end of this period compared
with the one at the end of the previous fiscal year, foreign exchange gains totaled ¥34.0 billion (U.S.$283
million), leading to an ordinary income of ¥70.5 billion (U.S.$587 million; compared with ¥6.0 billion in the
previous fiscal year) and a net income of ¥41.8 billion (U.S.$348 million; compared with a net loss of ¥23.2
billion in the previous fiscal year).
Segment information is omitted as Nintendo operates as a single business segment.
(2) Cash flow
The ending balance of “Cash and cash equivalents” (collectively, “Cash”) as of March 31, 2015 was ¥281.5
billion (U.S.$2,346 million), with a decrease of ¥59.7 billion during the fiscal year. During the previous fiscal
year, there was a decrease of ¥128.1 billion. Net increase (decrease) of Cash and contributing factors during the
fiscal year ended March 31, 2015 are as follows:
Net cash provided by (used in) operating activities:
There were decreasing factors contributing to ¥72.0 billion (U.S.$600 million) of income before income taxes
and minority interests such as yen depreciation of foreign exchanges, payment of various expenses and income
taxes. However, due to increasing factors such as decrease of inventory, net cash resulted in an increase of ¥60.2
billion (U.S.$502 million) compared to a decrease of ¥23.1 billion last year.
Net cash provided by (used in) investing activities:
Net cash from investing activities decreased by ¥105.3 billion (U.S.$878 million) compared to a decrease of
¥20.0 billion last year mainly due to payments into time deposits and purchase of short-term and long-term
investment securities exceeding proceeds from withdrawal of time deposits, sales of short-term and long-term
investment securities.
Net cash provided by (used in) financing activities:
Net cash from financing activities decreased by ¥11.9 billion (U.S.$99 million) compared to a decrease of ¥127.1
billion last year mainly due to payments of cash dividends.
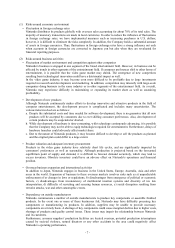
2. Risk factors
Listed below are the various risks that could significantly affect Nintendo’s operating results, share price and
financial condition. However, unpredictable risks may exist other than the risks set forth herein.
Note that matters pertaining to the future presented herein are determined by Nintendo as of the end of the fiscal
year ended March 31, 2015.