Nintendo 2015 Annual Report Download - page 7
Download and view the complete annual report
Please find page 7 of the 2015 Nintendo annual report below. You can navigate through the pages in the report by either clicking on the pages listed below, or by using the keyword search tool below to find specific information within the annual report.-
 1
1 -
 2
2 -
 3
3 -
 4
4 -
 5
5 -
 6
6 -
 7
7 -
 8
8 -
 9
9 -
 10
10 -
 11
11 -
 12
12 -
 13
13 -
 14
14 -
 15
15 -
 16
16 -
 17
17 -
 18
18 -
19
-
20
-
21
-
22
-
23
-
24
-
25
-
26
-
27
-
28
-
29
-
30
-
31
-
32
-
33
-
34
-
35
-
36
-
37
-
38
-
39
-
40
-
41
-
42
-
43
-
44
-
45
-
46
-
47
-
48
-
49
-
50
-
51
 |
 |

- 5 -
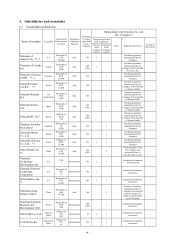
Name of company Location
Capital stock
or Investments
in capital
Description
of principal
business
Percentage
of voting
rights held
by the
Company
Relationship with Nintendo Co., Ltd.
(the “Company”)
Concurrent positions
held by directors
Loans Business transactions
Leasing of
fixed assets
Director
of the
Company
(number)
Employee
of the
Company
(number)
MONOLITH
SOFTWARE INC.
Meguro-ku,
Tokyo
Millions of
JPY
75
Development 97 1 1 –
Entrusted development
of software –
Nintendo Network
Services Inc.
Chiyoda-ku,
Tokyo
Millions of
JPY
480
Other 100 – 2 Granted
Entrusted management of
network services of the
Company
Leasing of
buildings
owned by
the
Company
Mario Club Co.,
Ltd.
Higashiyama
-ku, Kyoto
Millions of
JPY
450
Development 100 – 5 –
Entrusted inspection of
software etc.
Leasing of
buildings
owned by
the
Company
(Notes) 1. There are five other consolidated subsidiaries not listed above.
2. Figures in parentheses in Percentage of voting rights held by the Company represent the proportion of indirect
ownership.
3. Companies marked with *1 are specified subsidiaries.
4. Proportion of sales of consolidated subsidiaries marked with *2, excluding inter-company transactions of sales,
over total sales on a consolidated basis surpasses 10%. Major financial information is as follows.
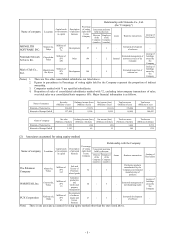
Name of company Net sales
(Millions of yen)
Ordinary income (loss)
(Millions of yen)
Net income (loss)
(Millions of yen)
Total net assets
(Millions of yen)
Total assets
(Millions of yen)
Nintendo of America Inc. 236,402 (7,315) (3,614) 176,004 259,170
Nintendo of Europe GmbH 137,208 5,509 1,820 65,899 104,432
Name of company Net sales
(Millions of dollars)
Ordinary income (loss)
(Millions of dollars)
Net income (loss)
(Millions of dollars)
Total net assets
(Millions of dollars)
Total assets
(Millions of dollars)
Nintendo of America Inc. 1,970 (60) (30) 1,466 2,159
Nintendo of Europe GmbH 1,143 45 15 549 870
(2) Associates accounted for using equity method
Name of company Location
Capital stock
or Investments
in capital
Description
of principal
business
Percentage
of voting
rights held
by the
Company
Relationship with the Company
Concurrent positions
held by directors
Loans Business transactions
Leasing of
fixed assets
Director
of the
Company
(number)
Employee
of the
Company
(number)
The Pokémon
Company
Minato-ku,
Tokyo
Millions of
JPY
365
Sale and
license of
Pokémon
related goods
32 – 1 –
Purchasing products
manufactured by the
Company and entrusted
manufacturing of
products
–
WARPSTAR, Inc. Chiyoda-ku,
Tokyo
Millions of
JPY
10
Animation
production
and
intellectual
property
management
50 – 3 –
Entrusted management of
merchandising rights
Leasing of
buildings
owned by
the
Company
PUX Corporation Kadoma-shi,
Osaka
Millions of
JPY
45
Development
of software
engine and
license
business
27 – 1 –
Entrusted development
of software –
(Note) There is one associate accounted for using equity method other than the ones listed above.