Nintendo 2015 Annual Report Download - page 19
Download and view the complete annual report
Please find page 19 of the 2015 Nintendo annual report below. You can navigate through the pages in the report by either clicking on the pages listed below, or by using the keyword search tool below to find specific information within the annual report.
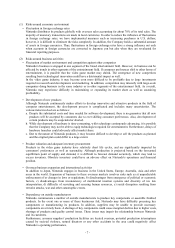
- 17 -
Previous fiscal year
(As of March 31, 2014)
Current fiscal year
(As of March 31, 2015)
(Millions of yen) (Millions of yen)
(Millions of
dollars)
Liabilities
Current liabilities
Notes and accounts payable - trade 47,665 58,464 487
Income taxes payable 14,803 16,529 137
Provision for bonuses 2,183 2,220 18
Other 90,999 67,018 558
Total current liabilities 155,652 144,232 1,201
Non-current liabilities
Net defined benefit liability 18,558 25,416 211
Other 13,760 15,739 131
Total non-current liabilities 32,318 41,155 342
Total liabilities 187,971 185,387 1,544
Net assets
Shareholders’ equity
Capital stock 10,065 10,065 83
Capital surplus 11,734 11,734 97
Retained earnings 1,378,085 1,409,764 11,748
Treasury shares (270,958) (270,986) (2,258)
Total shareholders’ equity 1,128,927 1,160,578 9,671
Accumulated other comprehensive income
Valuation difference on available-for-sale securities 13,628 16,671 138
Foreign currency translation adjustment (24,274) (9,804) (81)
Total accumulated other comprehensive income (10,645) 6,866 57
Minority interests 157 110 0
Total net assets 1,118,438 1,167,556 9,729
Total liabilities and net assets 1,306,410 1,352,944 11,274


