Nintendo 2015 Annual Report Download - page 12
Download and view the complete annual report
Please find page 12 of the 2015 Nintendo annual report below. You can navigate through the pages in the report by either clicking on the pages listed below, or by using the keyword search tool below to find specific information within the annual report.-
 1
1 -
 2
2 -
 3
3 -
 4
4 -
 5
5 -
 6
6 -
 7
7 -
 8
8 -
 9
9 -
 10
10 -
 11
11 -
 12
12 -
 13
13 -
 14
14 -
 15
15 -
 16
16 -
 17
17 -
 18
18 -
 19
19 -
 20
20 -
 21
21 -
 22
22 -
23
-
24
-
25
-
26
-
27
-
28
-
29
-
30
-
31
-
32
-
33
-
34
-
35
-
36
-
37
-
38
-
39
-
40
-
41
-
42
-
43
-
44
-
45
-
46
-
47
-
48
-
49
-
50
-
51
 |
 |
- 10 -
4. Analysis of financial position, operating results and cash flow
All financial information contained below is based on the consolidated financial statements disclosed in the Annual
Securities Report (Japanese only). Any forward-looking statements contained in the following overview are made
based on information available as of the end of the fiscal year ended March 31, 2015.
(1) Important accounting policies and assumptions
Consolidated financial statements of Nintendo are prepared in accordance with accounting standards generally
accepted in Japan. In preparing such statements, assumptions that may affect the value of assets, liabilities,
revenue and expenses are made based on the accounting policies selected and adopted by management.
Management takes into account past results and the likelihood of future events to form assumptions in a
reasonable fashion, but uncertainties inherent with such assumptions may cause the actual results to be
materially different from these assumptions. Important accounting policies adopted in the consolidated financial
statements of Nintendo are detailed in the section of “V. Financial Information, Consolidated financial
statements, etc., Basis of Presenting Consolidated Financial Statements.”
(2) Factors which may have a significant impact on operating results
Nintendo operates as a business in the field of home entertainment, in which the availability of hit titles and their
sales volumes may have a significant impact on its operating results. In addition, the field of entertainment is
wide in scope, and any successful non-gaming propositions that provide consumers with more entertainment
value and surprises may also have an impact.
More than 70% of Nintendo’s total sales are generated in the overseas markets, with most transactions carried
out in local currencies. While Nintendo has attempted to increase dollar-based purchases in order to reduce the
impact of exchange rate fluctuations, it is difficult to completely eliminate their risk. As a result, exchange rate
fluctuations may have an impact on Nintendo’s financial performance.
While video game systems and their compatible software, which are Nintendo’s main products, represent a
majority of total sales, hardware and software have very different profit margins, and fluctuations of their
proportions of the total sales may have an impact on gross profit and the gross profit percentage to sales.
In addition, there may be other fluctuating factors as described in “II. Business Overview, 2. Risk factors.”
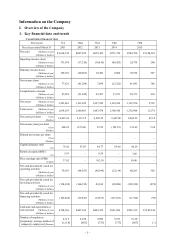
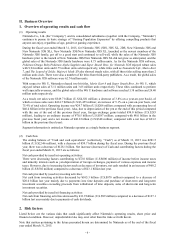
(3) Analysis of operating results for the fiscal year ended March 31, 2015
Sales decreased whereas profits increased when compared to the previous fiscal year.
(Net sales and operating income)
Net sales decreased from the previous fiscal year by ¥21.9 billion to ¥549.7 billion (U.S.$4,581 million; a
decrease of 3.8% on a year-over-year basis) due to decreased sales of the Nintendo 3DS hardware and
software, despite the increase in Wii U hardware and software sales. However, due to the increase in
Nintendo’s proportion in software and the yen depreciation, in addition to the increase in the proportion of
software in sales, gross profit increased from the previous fiscal year by ¥51.3 billion to ¥214.5 billion
(U.S.$1,788 million; an increase of 31.5% on a year-over-year basis). Due to such factors as the decrease in
advertising expenses stemming from the improved efficiency of marketing activities, total selling, general and
administrative expenses decreased from the previous fiscal year by ¥19.8 billion, resulting in an operating
income of ¥24.7 billion (U.S.$206 million; compared with an operating loss of ¥46.4 billion in the previous
fiscal year).
(Non-operating income and expenses, and ordinary income)
Net non-operating income was ¥45.7 billion (U.S.$380 million), due mainly to foreign exchange gains by yen
depreciation. As a result, ordinary income was ¥70.5 billion (U.S.$587 million; compared with ordinary
income of ¥6.0 billion in the previous fiscal year).
(Net income)
Net income was ¥41.8 billion (U.S.$348 million; compared with a net loss of ¥23.2 billion in the previous
fiscal year), due to lower income taxes than in the previous fiscal year as a result of the reversal of deferred
tax assets in relation to the losses carried over in the United States, in addition to the increase in ordinary
income.