Nintendo 2015 Annual Report Download - page 3
Download and view the complete annual report
Please find page 3 of the 2015 Nintendo annual report below. You can navigate through the pages in the report by either clicking on the pages listed below, or by using the keyword search tool below to find specific information within the annual report.-
 1
1 -
 2
2 -
 3
3 -
 4
4 -
 5
5 -
 6
6 -
 7
7 -
 8
8 -
 9
9 -
 10
10 -
 11
11 -
 12
12 -
 13
13 -
 14
14 -
15
-
16
-
17
-
18
-
19
-
20
-
21
-
22
-
23
-
24
-
25
-
26
-
27
-
28
-
29
-
30
-
31
-
32
-
33
-
34
-
35
-
36
-
37
-
38
-
39
-
40
-
41
-
42
-
43
-
44
-
45
-
46
-
47
-
48
-
49
-
50
-
51
 |
 |

- 1 -
Information on the Company
I. Overview of the Company
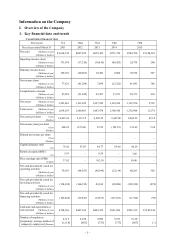
1. Key financial data and trends
Consolidated financial data
Fiscal year 71st 72nd 73rd 74th 75th
Fiscal year ended March 31 2011 2012 2013 2014 2015
Net sales (Millions of yen)
(Millions of dollars) ¥1,014,345 ¥647,652 ¥635,422 ¥571,726 ¥549,780 U.S.$4,581
Operating income (loss)
(Millions of yen)
(Millions of dollars)
171,076 (37,320) (36,410) (46,425) 24,770 206
Ordinary income (loss)
(Millions of yen)
(Millions of dollars)
128,101 (60,863) 10,482 6,086 70,530 587
Net income (loss)
(Millions of yen)
(Millions of dollars)
77,621 (43,204) 7,099 (23,222) 41,843 348
Comprehensive income
(Millions of yen)
(Millions of dollars)
47,659 (51,045) 49,307 17,971 59,373 494
Net assets (Millions of yen)
(Millions of dollars) 1,281,861 1,191,025 1,227,520 1,118,438 1,167,556 9,729
Total assets (Millions of yen)
(Millions of dollars) 1,634,297 1,368,401 1,447,878 1,306,410 1,352,944 11,274
Net assets per share (Yen)
(Dollars) 10,022.26 9,313.15 9,598.22 9,447.00 9,862.52 82.18
Net income (loss) per share
(Yen)
(Dollars)
606.99 (337.86) 55.52 (183.59) 353.49 2.94
Diluted net income per share
(Yen)
(Dollars)
– – – – – –
Capital adequacy ratio
(%) 78.42 87.03 84.77 85.60 86.29 –
Return on equity (ROE)
(%) 5.93 – 0.59 – 3.66 –
Price earnings ratio (PER)
(Times) 37.02 – 182.10 – 50.00 –
Net cash provided by (used in)
operating activities
(Millions of yen)
(Millions of dollars)
78,103 (94,955) (40,390) (23,114) 60,293 502
Net cash provided by (used in)
investing activities
(Millions of yen)
(Millions of dollars)
(154,038) (164,392) 89,104 (20,084) (105,394) (878)
Net cash provided by (used in)
financing activities
(Millions of yen)
(Millions of dollars)
(102,456) (39,823) (12,873) (127,163) (11,916) (99)
Cash and cash equivalents at
end of period (Millions of yen)
(Millions of dollars)
¥724,366 ¥407,186 ¥469,395 ¥341,266 ¥281,539 U.S.$2,346
Number of employees
[Separately, average number of
temporary employees] (Persons)
4,712
[1,114]
4,928
[803]
5,080
[753]
5,213
[717]
5,120
[667]
–
[–]