Nintendo 2007 Annual Report Download - page 6
Download and view the complete annual report
Please find page 6 of the 2007 Nintendo annual report below. You can navigate through the pages in the report by either clicking on the pages listed below, or by using the keyword search tool below to find specific information within the annual report.-
 1
1 -
 2
2 -
 3
3 -
 4
4 -
 5
5 -
 6
6 -
 7
7 -
 8
8 -
 9
9 -
 10
10 -
 11
11 -
 12
12 -
 13
13 -
 14
14 -
 15
15 -
 16
16 -
 17
17 -
18
-
19
-
20
-
21
 |
 |

<Appendix> Nintendo Co., Ltd.
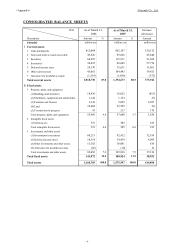
CONSOLIDATED BALANCE SHEETS
Date
Description Amount % Amount % Amount
(Assets) million yen million yen million yen
Current assets
1 Cash and deposits
2 Notes and trade accounts receivable
3 Securities
4 Inventories
5 Deferred income taxes
6 Other current assets
7 Allowance for doubtful accounts
Total current assets
Fixed assets
1 Property, plant, and equipment
(1) Buildings and structures
(2) Machinery, equipment and automobiles
(3) Furniture and fixtures
(4) Land
(5) Construction in progress
Total property, plant, and equipment
2 Intangible fixed assets
(1) Software etc.
Total intangible fixed assets
3 Investments and other assets
(1) Investments in securities
(2) Deferred income taxes
(3) Other investments and other assets
(4) Allowance for doubtful accounts
Total investments and other assets
Total fixed assets
Total assets
7.8
0.0 185
11.5 38,951
414,894
32,604 32,595 (8)
1,144 1,134
5,629
(9)
18,022 (815)
57,600 3.7
217
45,061
11,461
57,774
51,684
59,421
962,197
88.5
89,666
115,971
88,609
35,631
104,483
1,394,673
(1,886)
505
180,924
16,001
505
45,840
150,132
32,199
176
375,942
(372)
2,287
1,630
185
812,064
43,826
64,287
30,835
24,170
Increase
(decrease)
(10)
14,414
122,818
819
92,412
37,134
4,099
16
As of March 31,
2007
12.2
55,969
7.4
10,314
85,683
(26)
319
319 0.0
141,972
1,575,597
100.0 100.0
1,160,703
As of March 31,
2006
3,341
60,213
15,182
4.8
41
18,838
(1,514)
1,018,730 87.8
- 6 -