Nintendo 2007 Annual Report Download - page 11
Download and view the complete annual report
Please find page 11 of the 2007 Nintendo annual report below. You can navigate through the pages in the report by either clicking on the pages listed below, or by using the keyword search tool below to find specific information within the annual report.-
 1
1 -
 2
2 -
 3
3 -
 4
4 -
 5
5 -
 6
6 -
 7
7 -
 8
8 -
 9
9 -
 10
10 -
 11
11 -
 12
12 -
 13
13 -
 14
14 -
 15
15 -
 16
16 -
 17
17 -
 18
18 -
 19
19 -
 20
20 -
 21
21
 |
 |

<Appendix> Nintendo Co., Ltd.
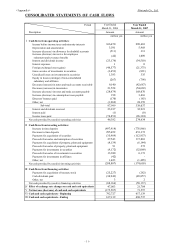
CONSOLIDATED STATEMENTS OF CASH FLOWS
Period
Description Amount Amount
million yen million yen
Cash flows from operating activities:
Income before income taxes and minority interests
Depreciation and amortization
Increase (decrease) in allowance for doubtful accounts
Interest and dividends income
Interest expenses
Foreign exchange losses (gains)
Gains on sales of investments in securities
Unrealized losses on investments in securities
Decrease (increase) in notes and trade accounts receivable
Decrease (increase) in inventories
Increase (decrease) in notes and trade accounts payable
Increase (decrease) in consumption taxes payable
Directors' bonuses paid
Other, net
Interest and dividends received
Interest paid
Income taxes paid
Net cash provided by (used in) operating activities
Cash flows from investing activities:
Increase in time deposits
Decrease in time deposits
Payments for acquisition of securities
Proceeds from sales and redemption of securities
Payments for acquisition of property, plant and equipment
Proceeds from sales of property, plant and equipment
Payments for investments in securities
Proceeds from sales of investments in securities
Payments for investments in affiliates
Other, net
Net cash provided by (used in) investing activities
Cash flows from financing activities:
Payments for acquisition of treasury stock
Cash dividends paid
Other, net
Net cash provided by (used in) financing activities
Net increase (decrease) of cash and cash equivalents
Cash and cash equivalents - Beginning
Cash and cash equivalents - Ending
(28,679)
198
(170)
(1,262)
27,543
295,452
(35,989)
(74,853)
3,591
166,470
5,968
289,601
Year Ended
March 31, 2006
Year Ended
March 31, 2007
Sub-total
32,921 23,237
97,999 338,037
Equity in losses (earnings) of non-consolidated
subsidiary and affiliates
1,089
313
(267)
(1)
(42,687)
(54,669)
9,140
21,554
Increase (decrease) in reserve for employee
s
retirement and severance benefit
s
117,001
651,372
(112,957)
3,416
(185)
24,359
168,070
(96,324)
(0)
0
(34,510)
(60,166)
Effect of exchange rate changes on cash and cash equivalents
3
(34,943)
2
(49,857)
(798)
(42)
(511)
1,383 335
(3,653)
(46,577)
(891)
(21,375)
(23,176)
1
46,382 274,634
(497,914) (776,866)
372
(4,139)
91
(6,144)
6,173
(52,069)
13,940
(9,172)
1,423
(174,603)
(1,485)
- (42)
47,003 21,704
(50,137)
(208,807)
(25,227) (282)
792,727
(175,587)
617,139 688,737
71,597
617,139
- 11 -