Nintendo 2007 Annual Report Download - page 4
Download and view the complete annual report
Please find page 4 of the 2007 Nintendo annual report below. You can navigate through the pages in the report by either clicking on the pages listed below, or by using the keyword search tool below to find specific information within the annual report.-
 1
1 -
 2
2 -
 3
3 -
 4
4 -
 5
5 -
 6
6 -
 7
7 -
 8
8 -
 9
9 -
 10
10 -
 11
11 -
 12
12 -
 13
13 -
 14
14 -
 15
15 -
16
-
17
-
18
-
19
-
20
-
21
 |
 |

<Appendix> Nintendo Co., Ltd.
(consolidated)
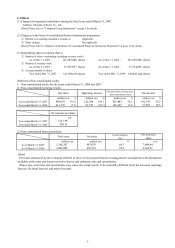
2. Financial Positions
Cash flows from operating activities:
Cash flows from investing activities:
Cash flows from financing activities:
Cash flow index trend
%%%%%
[Notes] Capital adequacy ratio: Total owners' equity and valuation and translation adjustments divided by Total assets
Capital adequacy ratio at market value: Total market value of stocks divided by Total assets
*Percentage figures are calculated on a consolidated basis.
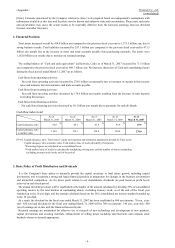
3. Basic Policy of Profit Distribution and Dividends
134.4
81.4
139.1
88.1
278.0
69.9
194.0
83.9
*Total market value of stocks is calculated by multiplying closing price and the number of shares outstanding
(excluding treasury stock) at the end of the period.
As of
March 31, 2007
Capital adequacy ratio
at market value
Capital adequacy ratio 82.0
118.8
As of
March 31, 2003
As of
March 31, 2004
As of
March 31, 2005
As of
March 31, 2006
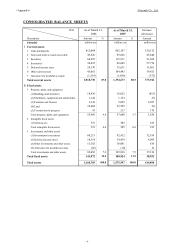
Total assets increased overall by 414.8 billion yen compared to the previous fiscal year-end to 1,575.5 billion yen, due to
strong business results. Total liabilities increased by 287.1 billion yen compared to the previous fiscal year-end to 473.5
billion yen mainly due to the increase in notes and trade accounts payable from purchasing materials. Net assets were
1,102.0 billion yen mostly due to increases in retained earnings.
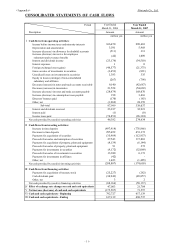
The ending balance of "Cash and cash equivalents" (collectively, Cash) as of March 31, 2007 increased by 71.5 billion
yen compared to the previous fiscal year-end to 688.7 billion yen. Net increase (decrease) of Cash and contributing factors
during the fiscal period ended March 31, 2007 are as follows.
Net cash from operating activities increased by 274.6 billion yen primarily due to increases in income before income
taxes and minority interests and notes and trade accounts payable.
Net cash from investing activities decreased by 174.6 billion yen mainly resulting from the decrease in time deposits
exceedin
g
the increase.
Net cash from financing activities decreased by 50.1 billion yen mainly due to payments for cash dividends.
It is the Company's basic policy to internally provide the capital necessary to fund future growth, including capital
investments, and to maintain a strong and liquid financial position in preparation for changes in the business environment
and intensified competition. As for direct profit returns to our shareholders, dividends are paid based on profit levels
achieved in each fiscal period.
The annual dividend per share will be established at the higher of the amount calculated by dividing 33% of consolidated
operating income by the total number of outstanding shares, excluding treasury stock, as of the end of the fiscal year
rounded up to the 10 yen digit, and the amount calculated based on the 50% consolidated net income standard rounded up
to the 10 yen digit.
As a result, the dividend for the fiscal year ended March 31, 2007 has been established at 690 yen (interim : 70 yen, year-
end : 620 yen) and dividend for the fiscal year ending March 31, 2008 will be 700 yen (interim : 140 yen, year-end : 560
yen) if earnings are in line with the financial forecast herein.
Retained earnings are maintained for effective use in research of new technology and development of new products,
capital investments and securing materials, enhancement of selling power including advertisement, and common stock
buyback whenever deemed appropriate.
[Note] Forecasts announced by the Company referred to above were prepared based on management's assumptions with
information available at this time and therefore involve known and unknown risks and uncertainties. Please note such risks
and uncertainties may cause the actual results to be materially different from the forecasts (earnings forecast, dividend
forecast, and other forecasts).
- 4 -