Nintendo 2007 Annual Report Download - page 13
Download and view the complete annual report
Please find page 13 of the 2007 Nintendo annual report below. You can navigate through the pages in the report by either clicking on the pages listed below, or by using the keyword search tool below to find specific information within the annual report.-
 1
1 -
2
-
 3
3 -
 4
4 -
 5
5 -
 6
6 -
 7
7 -
 8
8 -
 9
9 -
 10
10 -
 11
11 -
 12
12 -
 13
13 -
 14
14 -
 15
15 -
 16
16 -
 17
17 -
 18
18 -
 19
19 -
 20
20 -
 21
21
 |
 |

<Appendix> Nintendo Co., Ltd.
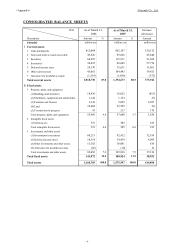
b. Segment Information
1. Segment Information by Business Categories
2. Segment Information by Seller's Location
Year ended March 31, 2006 million yen
Net sales
(1)
(2)
Total
Operating income
Ae
Year ended March 31, 2007 million ye
n
Net sales
(1)
(2)
Total
Operating income (losses)
Ae
3. Overseas sales
Year ended March 31, 2006 million yen
The America
s
Europe Other Total
Overseas sales ……………………………………………………
…
Consolidated net sales ……………………………………………
…
Ratio of overseas sales to consolidated net sales …………………
…
Year ended March 31
,
2007 million
y
e
n
The America
s
Europe Other Total
Overseas sales ……………………………………………………
…
Consolidated net sales ……………………………………………
…
Ratio of overseas sales to consolidated net sales …………………
…
(98)
509,249 6,956 129,869
249,219
266,156
677,783
3,151
16,952
761,223
210,493 161,929
Sales to third parties
686,529 340,345
Sales to third parties 331,385 352,377
Inter-segment sales 567,384 2,345
Operating expenses 1,292,928 (552,418)
898,770 266,171
569,866
1,536,401 16,735
247,508
14,378 212,240
1,335,389 15,247
740,509
Operating expenses
Japan The
Americas Consolidated
16,833
354,723
330,148 6,930
The
Americas
Europe Other Total
251,974 77 8 1,996
212,010 128,694 418,900
Eliminations
or
corporate
(569,866) 966,534
-
(251,974)
83,439
(251,974)
(258,883)
6,909
509,249 -
Total
Eliminations
or
corporate
243,472 (17,448)
(179,603)
Consolidated
90,349
966,534
(569,866) -
509,249
1,160,703
Japan Europe Other
16,614
7,034 411,819 212,490 129,878
975,312 145,474
81,671 480 1,183 104
36.5% 27.5% 2.5%
643,050
966,534
23,602 353,242 266,205
11,532
1,575,597 1,755,200
66.5%
249,890
2.2%
1,192,666 (31,963) 68,729
15 121
966,534
211,195 129,884
Inter-segment sales
69.2%
352,611
509,249
41.5% 25.5%
-
157,054
226,024
Considering similarities of categories, characteristics, manufacturing method, or sales market of what Nintendo deals in, the electronic
entertainment product segment accounts for over 90% of total sales and operating income of all business category segments, with no
other segments to be reported on the basis of disclosure rules. Therefore, this information is not applicable to Nintendo's business.
- 13 -