Nintendo 2007 Annual Report Download - page 1
Download and view the complete annual report
Please find page 1 of the 2007 Nintendo annual report below. You can navigate through the pages in the report by either clicking on the pages listed below, or by using the keyword search tool below to find specific information within the annual report.-
 1
1 -
 2
2 -
 3
3 -
 4
4 -
 5
5 -
 6
6 -
 7
7 -
 8
8 -
 9
9 -
 10
10 -
 11
11 -
 12
12 -
13
-
14
-
15
-
16
-
17
-
18
-
19
-
20
-
21
 |
 |
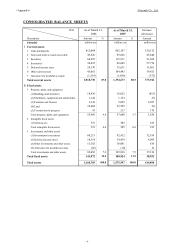
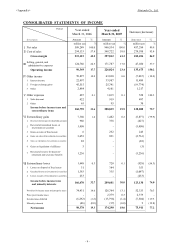
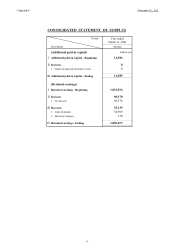
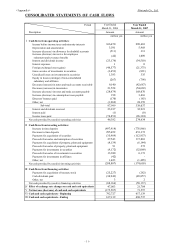
CONSOLIDATED FINANCIAL STATEMENTS
N
intendo Co., Ltd. and Consolidated Subsidiaries
April 26, 2007
N
intendo Co., Ltd.
11-1 Kamitoba hokotate-cho
,
Minami-ku, Kyoto 601-8501
Japan
FINANCIAL HIGHLIGHTS
1. Consolidated results for the years ended March 31, 2006 and 2007
(1) Consolidated operating results (Amounts below one million are rounded down)
Net sales Operating income Income before income taxes
and extraordinary items Net income
million yen % million yen % million yen % million yen %
Year ended March 31, 2007
Year ended March 31, 2006
Net income per share Return on equity
yen % % %
Year ended March 31, 2007
Year ended March 31, 2006
(2) Consolidated financial position
Total assets Net assets Capital adequacy
ratio
Net assets pe
r
share
million yen million yen % yen
As of March 31, 2007
As of March 31, 2006
(3) Consolidated cash flows
Cash and cas
h
e
q
uivalents - endin
g
million yen million yen million yen million yen
Year ended March 31, 2007
Year ended March 31, 2006
2. Cash dividends
Dividend per share
Interim Year-end Annual
yen yen yen million yen % %
Year ended Mar. 2006
Year ended Mar. 2007
Year ending Mar. 2008
(forecast)
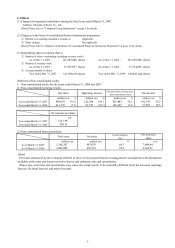
3. Forecast for the fiscal year ending March 2008 (April 1, 2007 - March 31, 2008)
million yen %million yen %million yen %million yen %yen
Six months ending Sept. 2007
Year ending Mar. 2008
[Notes] *With respect to this forecast, please refer to pages 3 and 4 for the forward-looking conditions and other related matters.
Dividends in total
(annual)
Dividend payout ratio
(consolidated basis)
Dividends on
net assets
Net sales Operating income Income before income taxes
and extraordinary items Net income Net income
per share
140.00
70.00
(208,807) 617,139
1,575,597 8,614.97
1,160,703
Cash flows fro
m
investing activities
Cash flows fro
m
financing activities
46,382 (60,166)
274,634
1,102,018 69.9
974,091
688,737 (50,137)
7,613.79 83.9
(174,603)
Cash flows fro
m
operating activities
89.8 966,534
509,249 (1.2)
1,362.61
762.28
150.2
226,024
90,349 (19.0)
79.7 288,839
160,759 10.6
77.2 174,290
98,378 12.5
Operating income
to net sales
Income before income taxes
and extraordinary items on
total assets
16.8
10.4
21.1
14.0
23.4
17.7
390.92
1,140,000 270,000 290,000 175,000 1,368.22
53.9 26.7 460,000 85,000 (8.0)
17.9 19.5 0.4 0.4
85,000 50,000
(10.2)
70.00 320.00
620.00
560.00
390.00
690.00
700.00
88,253
49,886 51.2
50.6
51.2
5.3
8.5
- 1 -