Nikon 2011 Annual Report Download - page 7
Download and view the complete annual report
Please find page 7 of the 2011 Nikon annual report below. You can navigate through the pages in the report by either clicking on the pages listed below, or by using the keyword search tool below to find specific information within the annual report.-
 1
1 -
 2
2 -
 3
3 -
 4
4 -
 5
5 -
 6
6 -
 7
7 -
 8
8 -
 9
9 -
 10
10 -
 11
11 -
 12
12 -
 13
13 -
 14
14 -
 15
15 -
 16
16 -
 17
17 -
 18
18 -
19
-
20
-
21
-
22
-
23
-
24
-
25
-
26
-
27
-
28
-
29
-
30
-
31
-
32
-
33
-
34
-
35
-
36
-
37
-
38
-
39
-
40
-
41
-
42
-
43
-
44
-
45
-
46
-
47
-
48
-
49
-
50
-
51
-
52
-
53
-
54
-
55
-
56
-
57
-
58
-
59
-
60
-
61
-
62
-
63
-
64
-
65
-
66
-
67
-
68
 |
 |

5Annual Report 2011Nikon Corporation
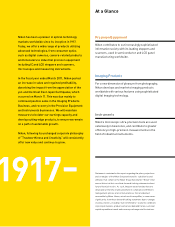
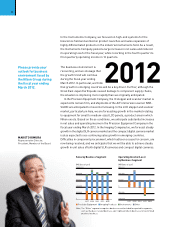
Nikon regained profitability in the fiscal year ended March 2011
despite the impact from the Great East Japan Earthquake, and made
progress toward achieving the goals of the previous medium term
management plan announced in June 2010. From the fiscal year ending
March 2012, we will focus on overcoming the difficulties in parts
procurement and other issues in the aftermath of the earthquake, the
timely launch of new products and strengthening marketing, sales,
service and other business processes. Through these measures Nikon
will aim to be the leading company in all of its principal businesses.
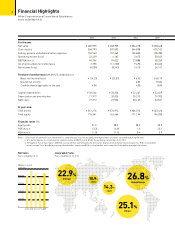
Nikon will make the necessary investments to strengthen and
expand existing businesses, and to support new business expansion.
R&D spending will be maintained at 6%–7% of net sales.
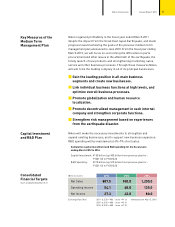
Cumulative capital investment and R&D spending for the fiscal years
ending March 2012 to 2014
Capital Investment: ¥150 billion (up ¥30 billion from previous plan for:
FY2011/3 to FY2013/3)
R&D Spending: ¥210 billion (up ¥10 billion from previous plan for:
FY2011/3 to FY2013/3)
Consolidated
Financial Targets
Years ended/ending March 31
Key Measures of the
Medium Term
Management Plan
Capital Investment
and R&D Plan
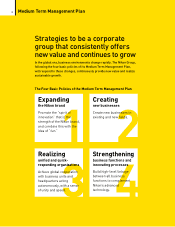
■ Gain the leading position in all main business
segments and create new businesses.
■ Link individual business functions at high levels, and
optimize overall business processes.
■ Promote globalization and human resource
localization.
■ Promote decentralized management in each internal
company and strengthen corporate functions.
■ Strengthen risk management based on experiences
from the earthquake disaster.
(Billions of yen) 2011 2012 2014
Net Sales 887.5 940.0 1,200.0
Operating Income 54.1 68.0 135.0
Net Income 27.3 42.0 80.0
Exchange Rate (Yen) 2011 U.S.$1 = ¥86 1 euro = ¥113 (Announced on May 12, 2011)
2012 U.S.$1 = ¥80 1 euro = ¥115
2014 U.S.$1 = ¥80 1 euro = ¥110