Nikon 2011 Annual Report Download - page 4
Download and view the complete annual report
Please find page 4 of the 2011 Nikon annual report below. You can navigate through the pages in the report by either clicking on the pages listed below, or by using the keyword search tool below to find specific information within the annual report.-
 1
1 -
 2
2 -
 3
3 -
 4
4 -
 5
5 -
 6
6 -
 7
7 -
 8
8 -
 9
9 -
 10
10 -
 11
11 -
 12
12 -
 13
13 -
 14
14 -
 15
15 -
16
-
17
-
18
-
19
-
20
-
21
-
22
-
23
-
24
-
25
-
26
-
27
-
28
-
29
-
30
-
31
-
32
-
33
-
34
-
35
-
36
-
37
-
38
-
39
-
40
-
41
-
42
-
43
-
44
-
45
-
46
-
47
-
48
-
49
-
50
-
51
-
52
-
53
-
54
-
55
-
56
-
57
-
58
-
59
-
60
-
61
-
62
-
63
-
64
-
65
-
66
-
67
-
68
 |
 |

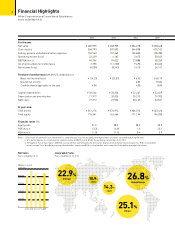
2Financial Highlights
Nikon Corporation and Consolidated Subsidiaries
Years ended March 31
2002 2003 2004 2005
For the year
Net sales ¥ 482,975 ¥ 468,959 ¥ 506,378 ¥ 638,468
Cost of sales 306,793 307,503 346,898 429,143
Selling, general and administrative expenses 153,943 157,269 155,805 178,780
Operating income (loss) 22,239 4,187 3,675 30,545
EBITDA (Note 3) 40,156 24,622 23,888 50,250
Income (loss) before income taxes 2,755 (11,128) 9,490 33,443
Net income (loss) (6,004) (8,143) 2,410 24,141
Per share of common stock (yen and U.S. dollars) (Note 1):
Basic net income (loss) ¥ (16.23) ¥ (22.03) ¥ 6.52 ¥ 65.19
Diluted net income 6.02 57.84
Cash dividends applicable to the year 4.00 4.00 8.00
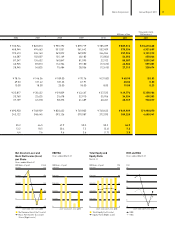
Capital expenditures ¥ 33,546 ¥ 20,226 ¥ 22,267 ¥ 22,459
Depreciation and amortization 17,917 20,435 20,213 19,705
R&D costs 27,313 27,506 30,165 33,561
At year-end:
Total assets ¥ 561,276 ¥ 576,912 ¥ 606,513 ¥ 633,426
Total equity 176,961 162,464 171,194 196,030
Financial ratios (%):
Equity ratio 31.5 28.2 28.2 30.9
ROE (Note 3) (3.3) (4.8) 1.4 13.1
ROA (Note 3) (1.0) (1.4) 0.4 3.9
Notes: 1. Per share of common stock information is computed based on the weighted average number of shares outstanding during the year.
2. U.S. dollar figures are translated for reference only at ¥83.15 to U.S.$1.00, the exchange rate at March 31, 2011.
3. Throughout this annual report, EBITDA is calculated as operating income (loss) plus depreciation and amortization expenses, ROE is calculated
as net income (loss) divided by average shareholders’ equity and ROA is calculated as net income (loss) divided by average total assets.