Netgear 2012 Annual Report Download - page 6
Download and view the complete annual report
Please find page 6 of the 2012 Netgear annual report below. You can navigate through the pages in the report by either clicking on the pages listed below, or by using the keyword search tool below to find specific information within the annual report.
Table of Contents
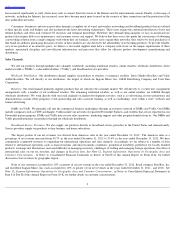
has increased significantly as well, where users seek to connect their televisions to the Internet and for entertainment content. Finally, as the usage of
networks, including the Internet, has increased, users have become much more focused on the security of their connections and the protection of the
data within their networks.
Consumers, businesses and service providers demand a complete set of wired and wireless networking and broadband products that are tailored
to their specific needs and budgets and also incorporate the latest networking technologies. These users require the continual introduction of new and
refined products and often lack extensive IT resources and technical knowledge. Therefore, they demand 'plug-and-play' or easy-to-
install and use
products that require little or no maintenance, and customer service and support. We believe that these users also prefer the convenience of obtaining
a networking solution from a single company with whom they are familiar; as these users expand their networks, they tend to be loyal purchasers of
that brand. In addition, purchasing decisions of users in these markets are also driven by the affordability of networking products. To provide reliable,
easy-to-use products at an attractive price, we believe a successful supplier must have a company-
wide focus on the unique requirements of these
markets, operational discipline and cost-
efficient infrastructure and processes that allow for efficient product development, manufacturing and
distribution.
Sales Channels
We sell our products through multiple sales channels worldwide, including traditional retailers, online retailers, wholesale distributors, direct
market resellers ("DMRs"), value-added resellers ("VARs"), and broadband service providers.
Wholesale Distribution. Our distribution channel supplies our products to retailers, e-
commerce resellers, Direct Market Resellers and Value
Added Resellers. We sell directly to our distributors, the largest of which are Ingram Micro, Inc., D&H Distributing Company and Tech Data
Corporation.
Retailers.
Our retail channel primarily supplies products that are sold into the consumer market. We sell directly to, or enter into consignment
arrangements with, a number of our traditional retailers. The remaining traditional retailers, as well as our online retailers, are fulfilled through
wholesale distributors. We work directly with our retail channels on market development activities, such as co-advertising, in-
store promotions and
demonstrations, instant rebate programs, event sponsorship and sales associate training, as well as establishing “store within a store”
websites and
banner advertising.
DMRs and VARs.
We primarily sell into the commercial business marketplace through an extensive network of DMRs and VARs. Our DMRs
include companies such as CDW and Insight. VARs include our network of registered Powershift Partners, and resellers that are not registered in our
Powershift partner program. DMRs and VARs may receive sales incentives, marketing support and other program benefits from us. Our DMRs and
VARs generally purchase our products through our wholesale distributors.
Broadband Service Providers.
We also supply our products directly to broadband service providers in the United States and internationally.
Service providers supply our products to their business and home subscribers.
The largest portion of our net revenues was derived from Americas sales in the year ended December 31, 2012
. The Americas sales as a
percentage of net revenue increased from 49.7% in the year ended December 31, 2011 to 53.4% in the year ended December 31, 2012. We have
continuously committed resources to expanding our international operations and sales channels. Accordingly, we are subject to a number of risks
related to international operations such as macroeconomic and microeconomic conditions, geopolitical instability, preference for locally branded
products, exchange rate fluctuations, increased difficulty in managing inventory, challenges of staffing and managing foreign operations, the effect of
international sales on our tax structure, and changes in local tax laws. See Note 12,
Segment Information, Operations by Geographic Area and
Customer Concentration , in Notes to Consolidated Financial Statements in Item 8 of Part II of this Annual Report on Form 10-
K, for further
discussion of net revenues by geographic region.
None of our customers accounted for 10% or greater of our net revenue in the year ended December 31, 2012. Retail company Best Buy, Inc.
and distributor Ingram Micro, Inc. each accounted for 10% or greater of our net revenues in the years ended December 31, 2011 , and 2010
. See
Note 12,
Segment Information, Operations by Geographic Area and Customer Concentration
, in Notes to Consolidated Financial Statements in
Item 8 of Part II of this Annual Report on Form 10-K, for further details on customer concentrations.
2

