Napa Auto Parts 2009 Annual Report Download - page 19
Download and view the complete annual report
Please find page 19 of the 2009 Napa Auto Parts annual report below. You can navigate through the pages in the report by either clicking on the pages listed below, or by using the keyword search tool below to find specific information within the annual report.-
 1
1 -
2
-
3
-
4
-
5
-
6
-
7
-
8
-
 9
9 -
 10
10 -
 11
11 -
 12
12 -
 13
13 -
 14
14 -
 15
15 -
 16
16 -
 17
17 -
 18
18 -
 19
19 -
 20
20 -
 21
21 -
 22
22 -
 23
23 -
 24
24 -
 25
25 -
 26
26 -
 27
27 -
 28
28 -
 29
29 -
30
-
31
-
32
-
33
-
34
-
35
-
36
-
37
-
38
-
39
-
40
-
41
-
42
-
43
-
44
-
45
-
46
-
47
-
48
-
49
-
50
-
51
-
52
-
53
-
54
-
55
-
56
-
57
-
58
-
59
-
60
-
61
-
62
-
63
-
64
-
65
-
66
-
67
-
68
-
69
-
70
-
71
 |
 |

Table of Contents
The following is a discussion of the Company’s financial condition at December 31, 2009. Our cash balance of $337 million was
up $269 million from December 31, 2008, due primarily to the decrease in inventory and increase in accounts payable in 2009 relative to
2008. In addition, we were less active in our Company share repurchase program in 2009 when compared to 2008. The Company’s
accounts receivable balance at December 31, 2009 decreased by approximately 3% from the prior year and inventory at December 31,
2009 was down by approximately 4% from December 31, 2008. Both of these decreases reflect our decline in sales for the year. Accounts
payable increased $85 million or approximately 8% from December 31, 2008, due primarily to improved payment terms with certain
suppliers and the ongoing expansion of our procurement card program. Goodwill and other intangible assets increased by $13 million or
8% from December 31, 2008 and relates primarily to the Company’s acquisitions during the year. The change in our December 31, 2009
balances for deferred taxes, down $51 million, as well as pension and other post-retirement benefits liabilities, down $202 million, is
primarily due to a pension contribution of $53 million and a change in funded status of the Company’s pension and other post-retirement
plans in 2009.
The Company’s sources of capital consist primarily of cash flows from operations, supplemented as necessary by private
issuances of debt and bank borrowings. We have $500 million of long-term debt outstanding at December 31, 2009, of which
$250 million matures in 2011 and $250 million matures in 2013. The capital and credit markets continue to be volatile and if these
conditions continue they are likely to impact our access to these markets. Currently, we believe that our available short-term and long-term
sources of capital are sufficient to fund the Company’s operations, including working capital requirements, scheduled debt payments,
interest payments, capital expenditures, benefit plan contributions, income tax obligations, dividends, share repurchases and
contemplated acquisitions.
The ratio of current assets to current liabilities was 2.9 to 1 at December 31, 2009 compared to 3.0 to 1 at December 31, 2008. Our
liquidity position remains solid. The Company had $500 million in total debt outstanding at December 31, 2009 and 2008. In addition,
at December 31, 2009, the Company had available a $350 million unsecured revolving line of credit. No amounts were outstanding under
the line of credit at December 31, 2009 and 2008.
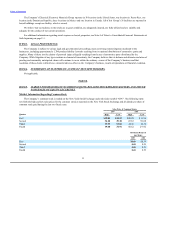
A summary of the Company’s consolidated statements of cash flows is as follows:
Operating Activities $ 530,309 $ 641,471 59% (17)%
Investing Activities (214,334) (87,598) 23% 145%
Financing Activities (472,573) (469,496) (30)% 1%
Net Cash Provided by Operating Activities:
The Company continues to generate cash and 2009 was an especially strong year, with net cash provided by operating activities
totaling $845 million in 2009. This represents a 59% increase from 2008, and primarily relates to the $368 million net decrease in cash
used for working capital requirements, including accounts receivable, inventory and accounts payable, net of the $76 million decrease in
net income from 2008. The 17% decrease in net cash provided by operating activities in 2008 was primarily due to the $116 million net
increase in cash used for working capital requirements, including accounts receivable, inventory and accounts payable, as well as the
$31 million decrease in net income from 2007.
19