Napa Auto Parts 2009 Annual Report Download - page 18
Download and view the complete annual report
Please find page 18 of the 2009 Napa Auto Parts annual report below. You can navigate through the pages in the report by either clicking on the pages listed below, or by using the keyword search tool below to find specific information within the annual report.-
 1
1 -
2
-
3
-
4
-
5
-
6
-
7
-
 8
8 -
 9
9 -
 10
10 -
 11
11 -
 12
12 -
 13
13 -
 14
14 -
 15
15 -
 16
16 -
 17
17 -
 18
18 -
 19
19 -
 20
20 -
 21
21 -
 22
22 -
 23
23 -
 24
24 -
 25
25 -
 26
26 -
 27
27 -
 28
28 -
29
-
30
-
31
-
32
-
33
-
34
-
35
-
36
-
37
-
38
-
39
-
40
-
41
-
42
-
43
-
44
-
45
-
46
-
47
-
48
-
49
-
50
-
51
-
52
-
53
-
54
-
55
-
56
-
57
-
58
-
59
-
60
-
61
-
62
-
63
-
64
-
65
-
66
-
67
-
68
-
69
-
70
-
71
 |
 |

Table of Contents
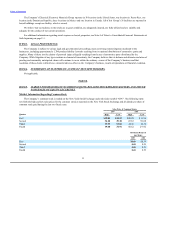
Automotive Group
Automotive income before income taxes as a percentage of net sales, which we refer to as operating margin, increased to 7.4% in
2009 from 7.2% in 2008. The improvement in operating margin for 2009 is attributed to the benefit of cost reduction measures
implemented during 2008 and 2009. Automotive’s initiatives to grow sales and control costs are intended to improve its operating margin
in the years ahead.
Automotive operating margins decreased to 7.2% in 2008 from 7.8% in 2007. The decline in operating margin for 2008 is attributed
to Automotive’s lower sales volume for the year, partially offset by the benefit of cost reduction measures.
Industrial Group
Industrial operating margins decreased to 5.6% in 2009 from 8.4% in 2008 and 2007. The decrease in operating margins in 2009
was primarily a reflection of the extreme downturn in industrial demand that we began to experience in the fourth quarter of 2008. These
conditions led to lower levels of sales volume in 2009, which severely impacted our expense leverage, despite our cost reduction efforts. In
addition, the decrease in inventory purchases in 2009, a direct result of lower sales, significantly reduced the level of volume incentives
earned during the year. These factors more than offset our sales initiatives and cost reduction efforts. We will continue to focus on these
areas, however, to show progress in the years ahead.
Office Group
Operating margins in Office were 7.7% in 2009, down from 8.3% in 2008 and 8.9% in 2007. The prevailing weakness in the office
products industry that began in 2007 continued to pressure the operating margins at Office in 2009. The decrease in revenues for these
three periods has negatively impacted our expense leverage. Our sales strategy remains to capture additional market share, despite the
industry slowdown.
Electrical Group
Operating margins in Electrical decreased to 7.3% in 2009 from 7.9% in 2008. In 2008, the Electrical operating margins had
increased to 7.9% from 7.0% in 2007 and marked the fifth consecutive year of operating margin improvement for Electrical. In 2009, the
decrease in operating margins was primarily a function of weak market conditions. This factor outweighed the benefits of Electrical’s
sales initiatives and expense savings. Ongoing efforts in these areas, as well as a more stable manufacturing sector, will serve to improve
Electrical’s future operating margins.
The effective income tax rate decreased to 38.0% in 2009 from 38.1% in 2008. The decrease from the 2008 rate is mainly due to tax-
free income in 2009 associated with a Company retirement plan. The 38.1% tax rate in 2008 had increased from 38.0% in 2007. The
increase from the prior year rate was mainly due to a non-deductible expense associated with a Company retirement plan.
Net income was $400 million in 2009, a decrease of 16% from $475 million in 2008. On a per share diluted basis, net income was
$2.50 in 2009 compared to $2.92 in 2008, down 14%. Net income in 2009 was 4.0% of net sales compared to 4.3% of net sales in 2008.
Net income was $475 million in 2008, a decrease of 6% from $506 million in 2007. On a per share diluted basis, net income was
$2.92 in 2008 compared to $2.98 in 2007, down 2%. Net income in 2008 was 4.3% of net sales compared to 4.7% of net sales in 2007.
18