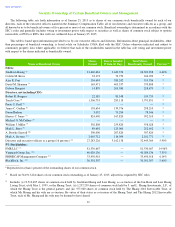
NVIDIA 2014 Annual Report Download - page 40
Download and view the complete annual report
Please find page 40 of the 2014 NVIDIA annual report below. You can navigate through the pages in the report by either clicking on the pages listed below, or by using the keyword search tool below to find specific information within the annual report.-
 1
1 -
2
-
3
-
4
-
5
-
6
-
7
-
8
-
9
-
10
-
11
-
12
-
13
-
14
-
15
-
16
-
17
-
18
-
19
-
20
-
21
-
22
-
23
-
24
-
25
-
26
-
27
-
28
-
29
-
 30
30 -
 31
31 -
 32
32 -
 33
33 -
 34
34 -
 35
35 -
 36
36 -
 37
37 -
 38
38 -
 39
39 -
 40
40 -
 41
41 -
 42
42 -
 43
43 -
 44
44 -
 45
45 -
 46
46 -
 47
47 -
 48
48 -
 49
49 -
 50
50 -
51
-
52
-
53
-
54
-
55
-
56
-
57
-
58
-
59
-
60
-
61
-
62
-
63
-
64
 |
 |

Table of Contents
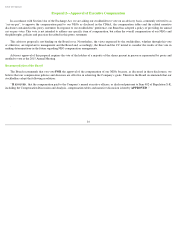
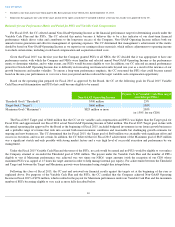
including our CEO. No NEO is present during discussions of his or her compensation package or participates directly in approving the amount
of any component of his or her own compensation package.
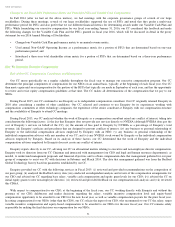
Factors Used in Determining Executive Compensation
In any given year, when establishing the elements of executive compensation, our CC may take into consideration one or more of the
following factors. The relative weight, if any, given to each of the factors below varies with each individual NEO and with respect to each
element of compensation at the sole discretion of our CC.
__________
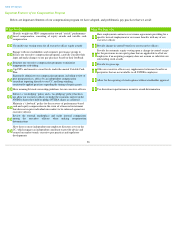
*
For a discussion of stock-based compensation cost, see Note 2 to our consolidated financial statements titled “Stock-Based Compensation” in our Form 10-K.
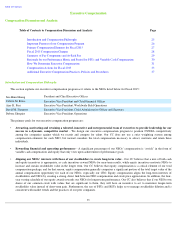
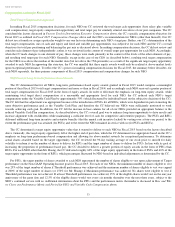
Peer Companies and Market Compensation Data
In late Fiscal 2014, Exequity and our human resources department recommended, and our CC approved, our peer companies for Fiscal 2015
which are companies that (i) we generally think we compete with for executive talent, (ii) have an established business, market presence, and
complexity similar to us, and (iii) are of similar size to us as measured by revenue (at roughly 0.5-
2.0x NVIDIA) and market capitalizations (at
roughly 0.5-
3.5x NVIDIA). Our peer group for Fiscal 2015 remained the same as it was for Fiscal 2014. The median revenue and market
capitalization for our peer group was approximately $4.2 billion and $12.0 billion, respectively, which closely approximates
our aggregate
revenue of $4.1 billion for Fiscal 2014 and market capitalization of approximately $9.0 billion in late Fiscal 2014.
Our CC reviews market practices for compensating our desired talent pool, including data from our peer group, for the three major
components of our compensation program and total target compensation. When reviewing and analyzing the amount of each major component
and the total compensation opportunity for our NEOs, our CC reviews each component at the 25th, 50th and 75th percentiles for our peer
companies for guidance. Our CC reviews these pay levels as reference points in its overall decision making, as indicative of the level of
compensation necessary to attract, retain and motivate our NEOs. Our CC sets the actual amount of each element of compensation and the total
compensation opportunity of each NEO based in part on its review of peer group data and in part on the factors discussed above and below in
Compensation Actions for Fiscal 2015 in respect of actual decisions for Fiscal 2015.
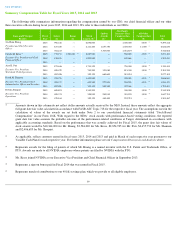
For fiscal year 2015, our peer group consisted of the companies listed below:
32
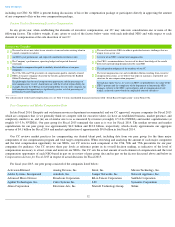
Factors we Consider
4
The need to attract new talent to our executive team and retain existing talent in
a highly competitive industry
4
The need to motivate NEOs to address particular business challenges that are
unique to any given year
4
An NEO’s past performance and expected contribution to future results
4
A review of an NEO’s current total compensation
4
The Company’s performance, operating budget and expected financial
constraints
4
Our CEO’s recommendations, because of his direct knowledge of the results
delivered and leadership demonstrated by each NEO
4
The trends in compensation paid to similarly situated officers at our peer
companies
4
The independent judgment of the members of our CC
4
The 25th, 50th and 75th percentiles of compensation paid to similarly situated
NEOs at our peer companies based on the the data gathered from the Radford
Global Technology Survey
4
The total compensation cost and stockholder dilution resulting from executive
compensation actions, as we believe this helps us maintain a responsible cost
structure for our compensation programs*
4
The philosophy that the total compensation opportunity and the percentage of
total compensation “at risk” should increase with the level of responsibility-for
example, because the CEO has overall responsibility for our entire company, his
total compensation opportunity is significantly greater, as is his percentage of
performance-based compensation
4
Internal pay equity-that is, we assess an NEO’s responsibilities, the scope of the
NEO’s position and the complexity of the department or function the NEO
manages, relative to the NEO’s internal peers, and set compensation levels
within a relatively narrow band for comparably situated executives
Activision Blizzard Analog Devices, Inc. Intuit, Inc. Micron Technology, Inc.
Adobe Systems, Incorporated Autodesk, Inc. Juniper Networks, Inc. Network Appliance, Inc.
Advanced Micro Devices Broadcom Corporation KLA-Tencor Corporation SanDisk Corporation
Agilent Technologies, Inc. Citrix Systems Inc. LSI Symantec Corporation
Altera Corporation Electronic Arts, Inc. Marvell Technology Group Xilinx