Motorola 2007 Annual Report Download - page 60
Download and view the complete annual report
Please find page 60 of the 2007 Motorola annual report below. You can navigate through the pages in the report by either clicking on the pages listed below, or by using the keyword search tool below to find specific information within the annual report.-
 1
1 -
2
-
3
-
4
-
5
-
6
-
7
-
8
-
9
-
10
-
11
-
12
-
13
-
14
-
15
-
16
-
17
-
18
-
19
-
20
-
21
-
22
-
23
-
24
-
25
-
26
-
27
-
28
-
29
-
30
-
31
-
32
-
33
-
34
-
35
-
36
-
37
-
38
-
39
-
40
-
41
-
42
-
43
-
44
-
45
-
46
-
47
-
48
-
49
-
 50
50 -
 51
51 -
 52
52 -
 53
53 -
 54
54 -
 55
55 -
 56
56 -
 57
57 -
 58
58 -
 59
59 -
 60
60 -
 61
61 -
 62
62 -
 63
63 -
 64
64 -
 65
65 -
 66
66 -
 67
67 -
 68
68 -
 69
69 -
 70
70 -
71
-
72
-
73
-
74
-
75
-
76
-
77
-
78
-
79
-
80
-
81
-
82
-
83
-
84
-
85
-
86
-
87
-
88
-
89
-
90
-
91
-
92
-
93
-
94
-
95
-
96
-
97
-
98
-
99
-
100
-
101
-
102
-
103
-
104
-
105
-
106
-
107
-
108
-
109
-
110
-
111
-
112
-
113
-
114
-
115
-
116
-
117
-
118
-
119
-
120
-
121
-
122
-
123
-
124
-
125
-
126
-
127
-
128
-
129
-
130
-
131
-
132
-
133
-
134
-
135
-
136
-
137
-
138
-
139
-
140
-
141
-
142
-
143
-
144
-
145
-
146
 |
 |

interest rate reset at least annually. The average reset maturity of the investments held by the funds must be
120 days or less with the actual average reset maturity of the investments being 40 days and 53 days at
December 31, 2007 and 2006, respectively.
During 2007, the Company recorded a $75 million reduction in the available-for-sale securities held in the
Sigma Fund, reflecting a decline in the fair value of the securities. As of December 31, 2007, $57 million of this
reduction represents a broad-based temporary decline in market value of various securities primarily due to credit
spreads widening in several debt market segments, with the offsetting reduction reflected in Non-owners changes
to equity. The Company believes credit market spreads will return to normal levels in the future. Additionally, due
to the high credit ratings of the underlying securities, it is probable that the Company will be able to collect all
amounts according to the contractual terms of the corporate bonds where fair values are less than their cost as of
December 31, 2007. It is for these reasons that the unrealized losses on these corporate bonds are considered
temporary. If it becomes probable that the Company will not collect all amounts in accordance with the
contractual terms of a corporate bond, the Company considers the decline other-than-temporary. The remaining
$18 million reduction in available-for-sale securities held by the Sigma Fund represents an other-than-temporary
decline and has been reflected as an investment impairment.
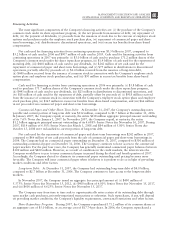
Strategic Acquisitions and Investments: The Company used net cash for acquisitions and new investment
activities of $4.6 billion in 2007, compared to net cash used of $1.1 billion in 2006 and net cash used of
$312 million in 2005. The largest components of the $4.6 billion in 2007 expenditures were: (i) $3.5 billion for
the acquisition of Symbol Technologies, Inc. (part of the Enterprise Mobility Solutions segment), (ii) $438 million
for the acquisition of Good Technology, Inc. (part of the Enterprise Mobility Solutions segment), (iii) $183 million
for Netopia, Inc. (part of the Home and Networks Mobility segment), (iv) $137 million for Terayon
Communications Systems (part of the Home and Networks Mobility segment), (v) the acquisition of Tut Systems,
Inc. (part of the Home and Networks Mobility segment), (vi) the acquisition of Modulus Video, Inc. (part of the
Home and Networks Mobility segment), and (vii) the acquisition of Leapstone Systems, Inc. (part of the Home
and Networks Mobility segment). The largest components of the $1.1 billion in 2006 expenditures were:
(i) $300 million for an equity investment in Clearwire, Inc., (ii) $193 million for the acquisition of TTP
Communications plc (part of the Mobile Devices segment), (iii) $181 million for the acquisition of Broadbus
Technologies, Inc. (part of the Home and Networks Mobility segment), (iv) $108 million for the acquisition of
Kreatel Communications AB (part of the Home and Networks Mobility segment), (v) the acquisition of Orthogon
Systems (part of the Enterprise Mobility Solutions segment), and (vi) the acquisition of NextNet Wireless, Inc.
(part of the Home and Networks Mobility segment).
Capital Expenditures: Capital expenditures were $527 million in 2007, compared to $649 million in 2006
and $548 million in 2005. The Company’s emphasis in making capital expenditures is to focus on strategic
investments driven by customer demand and new design capability.
Sales of Investments and Businesses: The Company received $411 million in proceeds from the sales of
investments and businesses in 2007, compared to proceeds of $2.0 billion in 2006 and $1.5 billion in 2005. The
$411 million in proceeds in 2007 were primarily comprised of $346 million from the sale of the Company’s
embedded communications computing business. The $2.0 billion in proceeds in 2006 were primarily comprised of:
(i) $856 million in net proceeds from the sale of the automotive electronics business, (ii) $820 million from the sale
of the Company’s remaining shares in Sprint Nextel Corporation (“Sprint Nextel”) and the termination and cash
settlement of a zero-cost collar derivative relating to these Sprint Nextel shares, and (iii) $175 million from the sale
of the Company’s remaining shares in Telus Corporation.
Short-Term Investments: At December 31, 2007, the Company had $612 million in short-term investments
(which are highly-liquid fixed-income investments with an original maturity greater than three months but less
than one year), compared to $620 million of short-term investments at December 31, 2006.
Investment Securities: In addition to available cash and cash equivalents, Sigma Fund balances and short-
term investments, the Company views its investment securities as an additional source of liquidity. The majority of
these securities represent investments in technology companies and, accordingly, the fair market values of these
securities are subject to substantial price volatility. In addition, the realizable value of these securities is subject to
market and other conditions. At December 31, 2007, the Company’s available-for-sale securities portfolio had an
approximate fair market value of $333 million, which represented a cost basis of $372 million and a net
unrealized loss of $39 million. At December 31, 2006, the Company’s available-for-sale securities portfolio had an
approximate fair market value of $130 million, which represented a cost basis of $70 million and a net unrealized
gain of $60 million.
52 MANAGEMENT’S DISCUSSION AND ANALYSIS
OF FINANCIAL CONDITION AND RESULTS OF OPERATIONS