Mitsubishi 2011 Annual Report Download - page 20
Download and view the complete annual report
Please find page 20 of the 2011 Mitsubishi annual report below. You can navigate through the pages in the report by either clicking on the pages listed below, or by using the keyword search tool below to find specific information within the annual report.-
 1
1 -
2
-
3
-
4
-
5
-
6
-
7
-
8
-
9
-
 10
10 -
 11
11 -
 12
12 -
 13
13 -
 14
14 -
 15
15 -
 16
16 -
 17
17 -
 18
18 -
 19
19 -
 20
20 -
 21
21 -
 22
22 -
 23
23 -
 24
24 -
 25
25 -
 26
26 -
 27
27 -
 28
28 -
 29
29 -
 30
30 -
31
-
32
-
33
-
34
-
35
-
36
-
37
-
38
-
39
-
40
-
41
-
42
-
43
-
44
-
45
-
46
-
47
-
48
-
49
-
50
-
51
-
52
-
53
-
54
-
55
-
56
-
57
-
58
-
59
-
60
-
61
-
62
-
63
-
64
-
65
-
66
-
67
-
68
-
69
-
70
 |
 |

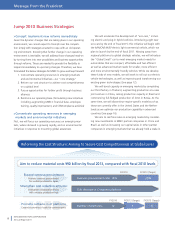
Global demand for automobiles showed signs of recovery in scal 2010, fueled by increased demand in Asia
and other emerging markets, led by continued strong growth in China. MMC’s sales volume (retail base)
bene ted not only from the overall global demand increase, but also from the effects of new model launches.
As a result, sales volume rose 145,000 units, or 15%, year on year, to 1,105,000 units (previous calculation
method*1). Net sales were affected by ongoing yen appreciation and effects of the Great East Japan Earthquake,
but thanks to the higher sales volume, net sales rose ¥382.9 billion, or 26%, year on year, to ¥1,828.5 billion.
MMC plans to achieve further revenue and pro t increases in scal 2011 by boosting sales volume and cutting
costs further. Accordingly, we are targeting net sales of ¥1,950.0 billion and operating income of ¥50.0 billion.
Net Sales
(Billions of yen)
FY2009 FY2010 FY2013 (Forecast)
Japan 368.5 363.3 370.0
North America 175.4 189.8 190.0
Europe 269.2 490.0 510.0
Asia and Other Regions 632.5 785.4 880.0
Total 1,445.6 1,828.5 1,950.0
Operating Income (Loss)
(Billions of yen)
FY2009 FY2010 FY2013 (Forecast)
Japan (1.2) 5.1 7.0
North America (28.2) (27.9) (33.0)
Europe 0.8 (26.4) (17.0)
Asia and Other Regions 42.5 89.5 93.0
Total 13.9 40.3 50.0
Overview of Operations by Region
(Billions of yen)
0
500
1,000
1,500
2,000
2011
(Forecast)
20102009
n Japan n North America n Europe n Asia and Other Regions
632.5 785.4 880.0
510.0
190.0
3,70.0
490.0
189.8
363.3
1,828.5 1,950.0
269.2
175.4
368.5
1,445.6
-100
-50
0
50
100
2011
(Forecast)
20102009
(Billions of yen)
n Japan n North America n Europe n Asia and Other Regions
7,854 8,800
93.0
7.0
89.5
5.1
40.3 50.0
42.5
0.8
13.9
(28.2) (1.2)
(26.4)
(27.9) (33.0)
(17.0)
0
300
600
900
1,200
2011
(Target)
20102009
(Thousands of units)
n Japan n North America n Europe n Asia and Other Regions
532 629 576
227
108
164
218
94
164
218
511
94
164
1,105
987 1,075
169
88
171
960
(New calculation method)(Previous calculation method)
Sales Volume (Retail)
(Thousands of units)
FY2009 FY2010 FY2013 (Target)
(Previous calculation
method)*1(New calculation method)*2
Japan 171 164 164 164
North America 88 94 94 108
Europe 169 218 218 227
Asia and Other Regions 532 629 511 576
Total 960 1,105 987 1,075
*1 The previous calculation method included retail units designed by MMC and sold by
other manufacturers under their brand name that provided royalty income.
*2 The new calculation method, initiated in fiscal 2011, includes only MMC-branded units.
In fiscal 2010, despite ongoing yen appreciation MMC
achieved revenue and profit increases by boosting sales
volumes and reducing costs.
MITSUBISHI MOTORS CORPORATION
Annual Report 2011
18