Mattel 2013 Annual Report Download - page 2
Download and view the complete annual report
Please find page 2 of the 2013 Mattel annual report below. You can navigate through the pages in the report by either clicking on the pages listed below, or by using the keyword search tool below to find specific information within the annual report.-
 1
1 -
 2
2 -
 3
3 -
 4
4 -
 5
5 -
 6
6 -
 7
7 -
 8
8 -
 9
9 -
 10
10 -
 11
11 -
 12
12 -
 13
13 -
14
-
15
-
16
-
17
-
18
-
19
-
20
-
21
-
22
-
23
-
24
-
25
-
26
-
27
-
28
-
29
-
30
-
31
-
32
-
33
-
34
-
35
-
36
-
37
-
38
-
39
-
40
-
41
-
42
-
43
-
44
-
45
-
46
-
47
-
48
-
49
-
50
-
51
-
52
-
53
-
54
-
55
-
56
-
57
-
58
-
59
-
60
-
61
-
62
-
63
-
64
-
65
-
66
-
67
-
68
-
69
-
70
-
71
-
72
-
73
-
74
-
75
-
76
-
77
-
78
-
79
-
80
-
81
-
82
-
83
-
84
-
85
-
86
-
87
-
88
-
89
-
90
-
91
-
92
-
93
-
94
-
95
-
96
-
97
-
98
-
99
-
100
-
101
-
102
-
103
-
104
-
105
-
106
-
107
-
108
-
109
-
110
-
111
-
112
-
113
-
114
-
115
-
116
-
117
-
118
-
119
-
120
-
121
-
122
-
123
-
124
-
125
-
126
-
127
-
128
-
129
-
130
-
131
-
132
 |
 |

(For the Year Ending December 31, 2013)
1 Year 3 Year 5 Year 10 Year
Mattel, Inc. 34% 28% 29% 13%
S&P 32% 16% 18% 7%
Total Shareholder Return (TSR)
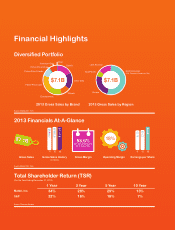
Diversified Portfolio
2013 Gross Sales by Brand
$7.1B
2013 Gross Sales by Region
$7.1B
North American
(US, Canada & American Girl)
Latin America
Europe
Asia-Pacifi c
Barbie
Other Girls
Wheels
Entertainment
Fisher-Price Core
Fisher-Price Friends
Fisher-Price Other
American Girl Other
Financial Highlights
Source: Mattel 2013 10-K
Source: Mattel 2013 10-K
Source: Thomson Reuters
Gross Sales Operating Margin
2013 Financials At-A-Glance
Gross Sales History
(in millions)
11 12 13
$6,841.1
$7,052.6
$7,117.8
Earnings per Share
$2.18
$2.22
$2.58
11 12 13
Gross Margin