LeapFrog 2009 Annual Report Download - page 5
Download and view the complete annual report
Please find page 5 of the 2009 LeapFrog annual report below. You can navigate through the pages in the report by either clicking on the pages listed below, or by using the keyword search tool below to find specific information within the annual report.-
 1
1 -
 2
2 -
 3
3 -
 4
4 -
 5
5 -
 6
6 -
 7
7 -
 8
8 -
 9
9 -
 10
10 -
 11
11 -
 12
12 -
 13
13 -
 14
14 -
 15
15 -
 16
16 -
17
-
18
-
19
-
20
-
21
-
22
-
23
-
24
-
25
-
26
-
27
-
28
-
29
-
30
-
31
-
32
-
33
-
34
-
35
-
36
-
37
-
38
-
39
-
40
-
41
-
42
-
43
-
44
-
45
-
46
-
47
-
48
-
49
-
50
-
51
-
52
-
53
-
54
-
55
-
56
-
57
-
58
-
59
-
60
-
61
-
62
-
63
-
64
-
65
-
66
-
67
-
68
-
69
-
70
-
71
-
72
-
73
-
74
-
75
-
76
-
77
-
78
-
79
-
80
-
81
-
82
-
83
-
84
-
85
-
86
-
87
-
88
-
89
-
90
-
91
-
92
-
93
-
94
-
95
-
96
-
97
-
98
-
99
-
100
-
101
-
102
-
103
-
104
-
105
-
106
-
107
-
108
-
109
-
110
-
111
-
112
-
113
-
114
-
115
-
116
-
117
-
118
-
119
-
120
-
121
-
122
-
123
-
124
-
125
-
126
-
127
-
128
-
129
-
130
-
131
-
132
-
133
-
134
-
135
-
136
-
137
-
138
-
139
-
140
-
141
-
142
-
143
-
144
-
145
-
146
-
147
-
148
-
149
-
150
-
151
-
152
-
153
-
154
-
155
-
156
-
157
-
158
-
159
-
160
-
161
-
162
-
163
-
164
-
165
-
166
-
167
-
168
-
169
-
170
-
171
-
172
-
173
-
174
-
175
-
176
-
177
-
178
-
179
-
180
 |
 |

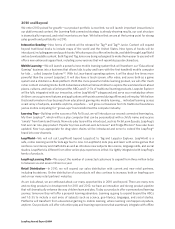
products. Content will translate across platforms, from books to e-Books to gaming systems to mobile learning
systems to online. Through LeapWorld and the Learning Path, we will create a marketplace where we market
and manage the delivery of content and applications for our devices. We are developing a real ecosystem with
a real community. The market trend is toward the online world, and we are already there.
With all this innovation in the pipeline, multiple strong product franchises, a connected strategy that is driving
customer engagement and loyalty, state-of-the-art operational systems, a dramatically lower cost structure,
and a proven team, we are well positioned for future growth and cash fl ow.
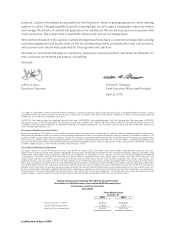
We’d like to conclude by thanking our customers, employees, business partners, and fellow stockholders for
their continued commitment and support of LeapFrog.
Sincerely,
Je rey G. Katz William B. Chiasson
Executive Chairman Chief Executive O cer and President
April 21, 2010
This letter to stockholders contains forward-looking statements, including statements about future fi nancial results, anticipated product launches, and the
anticipated e ects of current strategies on our business. Please see the special note on forward-looking statements on page i of the enclosed LeapFrog
Enterprises, Inc. 2009 Annual Report on Form 10-K.
LEAPFROG, the LeapFrog logo, the LeapFrog Learning Path logo, LEAPWORLD, the LeapWorld logo, TAG, the Tag logo, the Tag Junior logo, LEAPSTER,
the Leapster2 logo, LEAPSTER EXPLORER, the Leapster Explorer logo, LEAPLET, MY OWN LEAPTOP, LEARN & GROOVE, FRIDGE PHONICS and SEE THE
LEARNING are some of the trademarks or registered trademarks of LeapFrog Enterprises, Inc. This letter contains these and other trademarks and service
marks of LeapFrog Enterprises, Inc.
Description of Retail Point-of-Sale Dollars
Retail point-of-sale, or POS, dollars is a non-audited operating metric that represents a measure of U.S. retailers’ sales of LeapFrog products to consumers.
Retail point-of-sale dollars di ers signifi cantly from LeapFrog’s reported net sales, which refl ect all products sold by LeapFrog to its retailer customers in all
markets and also includes other sources of revenue. The point-of-sale data is provided to LeapFrog by retailers. LeapFrog believes this represents approximately
95% of our U.S. retailers’ dollar sales of LeapFrog products to consumers based on historical shipments by us to such retailers. LeapFrog management uses
point-of-sale data to evaluate the retail channel sales environment and develop net sales forecasts. Results for full year retail point-of-sale dollars are for the
52-weeks ended January 2, 2010 and the 52-weeks ended January 3, 2009.
Use of Non-GAAP Financial Information
This letter contains a non-GAAP fi nancial measure: non-GAAP net income (loss). The table in the reconciliation schedule below reconciles this non-
GAAP fi nancial measure to the most directly comparable fi nancial measure prepared in accordance with accounting principles generally accepted in the
United States. Non-GAAP fi nancial measures should not be considered as a substitute for, or as superior to, measures of fi nancial performance prepared
in accordance with GAAP. Non-GAAP fi nancial measures do not refl ect a comprehensive system of accounting, and they di er from GAAP measures with
similar names and from non-GAAP fi nancial measures with the same or similar names that are used by other companies. We strongly urge investors and
potential investors in our securities to review the reconciliation of non-GAAP net income (loss) to the comparable GAAP fi nancial measure of net income
(loss) that is included in this letter and in our consolidated fi nancial statements, including the notes thereto, and the other fi nancial information contained in
our periodic fi lings with the SEC, and not to rely on any single fi nancial measure to evaluate our business. We believe that this non-GAAP fi nancial measure
provides useful information to investors because it allows investors to view our fi nancial performance using a measure that we use internally to assess our
business and provides meaningful supplemental information regarding our operating results because it excludes amounts that we exclude as we monitor our
fi nancial results and assess the performance of the business. Non-GAAP net income (loss) represents net income (loss) plus stock-based compensation
expense. Below is a reconciliation of non-GAAP net income to the most directly comparable GAAP measure: net income (loss).
LeapFrog Annual Report 2009
Supplemental Disclosure Regarding Non-GAAP Financial Information
Reconciliation of GAAP Net Income (Loss) to Non-GAAP Net Income (Loss)
(In thousands, except per share data)
(Unaudited)
Twelve Months Ended
December 31,
2009 2008
Net income (loss) – GAAP $(2,688) $(68,354)
Stock-based compensation 10,696 11,109
Non-GAAP net income (loss) $8,008 $(57,245)