LeapFrog 2009 Annual Report Download - page 12
Download and view the complete annual report
Please find page 12 of the 2009 LeapFrog annual report below. You can navigate through the pages in the report by either clicking on the pages listed below, or by using the keyword search tool below to find specific information within the annual report.Our 2009 operating expenses were reduced by 31% as a result of our heightened expense control. Headcount
reductions occurred across all levels and business segments, resulting in a 14% reduction in fulltime employees
during 2009. Advertising expenses declined 42% for the year as we leveraged less costly alternatives, such as
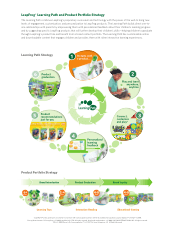
direct-to-consumer marketing programs through the LeapFrog Learning Path, instead of traditional marketing
programs.
The results for the fourth quarter of 2009 reflect dramatic improvements: net sales and gross profit improved by
37% and 73%, respectively, over the same period of 2008. Loss from operations and net income improved 172%
and 165%, respectively, in 2009 resulting in a return to profitability for not only the fourth quarter of 2009, but
also for the second half of 2009. We believe the stronger results validate that the strategies we put in place in
response to the economic crisis were on point and successfully executed.
Business Segments and Operations
We organize, operate and assess our business in two primary operating segments: United States and
International. Historically, we operated a School segment that sold products tailored for the United States
educational market directly to schools, teacher supply stores and through catalogs and websites aimed at
educators. During 2008, we significantly reduced our direct marketing to the educational channel, reduced
headcount and direct facilities expenses accordingly, and transferred responsibility for this sales channel to the
former U.S Consumer operating segment. This modification is consistent with how the chief operating decision
maker reviews performance, allocates resources and manages the business. Accordingly, we have consolidated
and reclassified the results of the operating segments formerly known as the U.S. Consumer and School segments
into the United States segment for the fiscal years ended December 31, 2009, 2008 and 2007. See Note 19—
“Segment Reporting” in our Consolidated Financial Statements included in this Form 10-K for certain detailed
information on our segments and their financial results for the fiscal years ended December 31, 2009, 2008 and
2007. The information included throughout this Form 10-K reflects the reclassification of prior period segment
information to conform to the presentation of the current period.
Overview of Business Segments
The operations of our business segments are described below.
•United States: The United States segment is responsible for the development, design, marketing and
sales of our products, primarily through retail channels and through our website in the United States. We
market and sell our products directly to national and regional mass-market and specialty retailers and
other retail stores, distributors, and directly through sales representatives. We also sell our products
through our online store and other Internet-based channels. The United States segment represented
approximately 81%, 79% and 77% of LeapFrog’s consolidated net sales in 2009, 2008 and 2007,
respectively. The vast majority of this segment’s sales are to a few large retailers. Sales invoiced to
Wal-Mart, Toys “R” Us and Target in aggregate accounted for approximately 65%, 69% and 64% of the
segment’s gross sales in 2009, 2008 and 2007, respectively. Each of these customers accounted for more
than 10% of our consolidated and United States segment’s gross sales in each of 2009, 2008 and 2007.
Accordingly, the loss of any of these three customers would have a material adverse effect on our
business.
•International: The International segment is responsible for the localization, marketing and sales of our
products originally developed for the United States, sold primarily in retail channels outside of the
United States. We market and sell our products to retailers outside the United States primarily through
various distribution arrangements. We have sales offices in Canada, France, Mexico and the United
Kingdom, or U.K. We also maintain various distribution and marketing arrangements in countries such
as Australia, Japan, Germany and Korea, among others. Our International segment represented
approximately 19%, 21% and 23% of our consolidated net sales in 2009, 2008 and 2007, respectively.
No single country represented 10% or more of LeapFrog’s consolidated net sales in any of the three
2


