KeyBank 2013 Annual Report Download - page 6
Download and view the complete annual report
Please find page 6 of the 2013 KeyBank annual report below. You can navigate through the pages in the report by either clicking on the pages listed below, or by using the keyword search tool below to find specific information within the annual report.-
 1
1 -
 2
2 -
 3
3 -
 4
4 -
 5
5 -
 6
6 -
 7
7 -
 8
8 -
 9
9 -
 10
10 -
 11
11 -
 12
12 -
 13
13 -
 14
14 -
 15
15 -
 16
16 -
 17
17 -
18
-
19
-
20
-
21
-
22
-
23
-
24
-
25
-
26
-
27
-
28
-
29
-
30
-
31
-
32
-
33
-
34
-
35
-
36
-
37
-
38
-
39
-
40
-
41
-
42
-
43
-
44
-
45
-
46
-
47
-
48
-
49
-
50
-
51
-
52
-
53
-
54
-
55
-
56
-
57
-
58
-
59
-
60
-
61
-
62
-
63
-
64
-
65
-
66
-
67
-
68
-
69
-
70
-
71
-
72
-
73
-
74
-
75
-
76
-
77
-
78
-
79
-
80
-
81
-
82
-
83
-
84
-
85
-
86
-
87
-
88
-
89
-
90
-
91
-
92
-
93
-
94
-
95
-
96
-
97
-
98
-
99
-
100
-
101
-
102
-
103
-
104
-
105
-
106
-
107
-
108
-
109
-
110
-
111
-
112
-
113
-
114
-
115
-
116
-
117
-
118
-
119
-
120
-
121
-
122
-
123
-
124
-
125
-
126
-
127
-
128
-
129
-
130
-
131
-
132
-
133
-
134
-
135
-
136
-
137
-
138
-
139
-
140
-
141
-
142
-
143
-
144
-
145
-
146
-
147
-
148
-
149
-
150
-
151
-
152
-
153
-
154
-
155
-
156
-
157
-
158
-
159
-
160
-
161
-
162
-
163
-
164
-
165
-
166
-
167
-
168
-
169
-
170
-
171
-
172
-
173
-
174
-
175
-
176
-
177
-
178
-
179
-
180
-
181
-
182
-
183
-
184
-
185
-
186
-
187
-
188
-
189
-
190
-
191
-
192
-
193
-
194
-
195
-
196
-
197
-
198
-
199
-
200
-
201
-
202
-
203
-
204
-
205
-
206
-
207
-
208
-
209
-
210
-
211
-
212
-
213
-
214
-
215
-
216
-
217
-
218
-
219
-
220
-
221
-
222
-
223
-
224
-
225
-
226
-
227
-
228
-
229
-
230
-
231
-
232
-
233
-
234
-
235
-
236
-
237
-
238
-
239
-
240
-
241
-
242
-
243
-
244
-
245
 |
 |

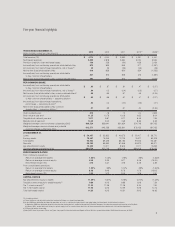
(a) Non-GAAP financial measure. Please see Figure 4 on page 42 of the attached Annual Report on Form 10-K for a reconciliation of Non-GAAP financial measures to GAAP.
(b) Source: SNL Financial and peer SEC filings; peers include: BBT, CMA, FITB, HBAN, MTB, PNC, RF, STI, USB and ZION.
4
2013 results
2009 2010 2011 2012 2013
$0.0
$5.0
$10.0
$15.0
$20.0
$25.0 $23.7
2009 2010 2011 2012 2013
$0
$100
$200
$300
$400 $333
2009 2010 2011 2012 2013
60%
64%
68%
72%
76%
65%
2009 2010 2011 2012 2013
.00%
1.00%
2.00%
3.00%
4.00%
.32%
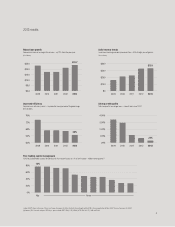
Robust loan growth
Commercial, financial and agricultural loans – up 12% from the prior year.
($ in billions)
Solid revenue trends
Investment banking and debt placement fees – fifth straight year of growth.
($ in millions)
Improved efficiency
Adjusted cash efficiency ratio(a) – improved to the upper end of targeted range,
60% to 65%.
Strong credit quality
Net charge-offs to average loans – lowest level since 2007.
Peer-leading capital management
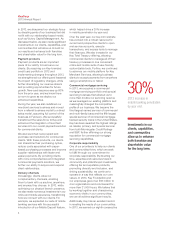
2013 total shareholder payout (dividends and share repurchases as a % of net income) – highest among peers.(b)
Key Peers
0%
20%
40%
60%
80% 76%