KeyBank 2013 Annual Report Download - page 4
Download and view the complete annual report
Please find page 4 of the 2013 KeyBank annual report below. You can navigate through the pages in the report by either clicking on the pages listed below, or by using the keyword search tool below to find specific information within the annual report.-
 1
1 -
 2
2 -
 3
3 -
 4
4 -
 5
5 -
 6
6 -
 7
7 -
 8
8 -
 9
9 -
 10
10 -
 11
11 -
 12
12 -
 13
13 -
 14
14 -
 15
15 -
16
-
17
-
18
-
19
-
20
-
21
-
22
-
23
-
24
-
25
-
26
-
27
-
28
-
29
-
30
-
31
-
32
-
33
-
34
-
35
-
36
-
37
-
38
-
39
-
40
-
41
-
42
-
43
-
44
-
45
-
46
-
47
-
48
-
49
-
50
-
51
-
52
-
53
-
54
-
55
-
56
-
57
-
58
-
59
-
60
-
61
-
62
-
63
-
64
-
65
-
66
-
67
-
68
-
69
-
70
-
71
-
72
-
73
-
74
-
75
-
76
-
77
-
78
-
79
-
80
-
81
-
82
-
83
-
84
-
85
-
86
-
87
-
88
-
89
-
90
-
91
-
92
-
93
-
94
-
95
-
96
-
97
-
98
-
99
-
100
-
101
-
102
-
103
-
104
-
105
-
106
-
107
-
108
-
109
-
110
-
111
-
112
-
113
-
114
-
115
-
116
-
117
-
118
-
119
-
120
-
121
-
122
-
123
-
124
-
125
-
126
-
127
-
128
-
129
-
130
-
131
-
132
-
133
-
134
-
135
-
136
-
137
-
138
-
139
-
140
-
141
-
142
-
143
-
144
-
145
-
146
-
147
-
148
-
149
-
150
-
151
-
152
-
153
-
154
-
155
-
156
-
157
-
158
-
159
-
160
-
161
-
162
-
163
-
164
-
165
-
166
-
167
-
168
-
169
-
170
-
171
-
172
-
173
-
174
-
175
-
176
-
177
-
178
-
179
-
180
-
181
-
182
-
183
-
184
-
185
-
186
-
187
-
188
-
189
-
190
-
191
-
192
-
193
-
194
-
195
-
196
-
197
-
198
-
199
-
200
-
201
-
202
-
203
-
204
-
205
-
206
-
207
-
208
-
209
-
210
-
211
-
212
-
213
-
214
-
215
-
216
-
217
-
218
-
219
-
220
-
221
-
222
-
223
-
224
-
225
-
226
-
227
-
228
-
229
-
230
-
231
-
232
-
233
-
234
-
235
-
236
-
237
-
238
-
239
-
240
-
241
-
242
-
243
-
244
-
245
 |
 |

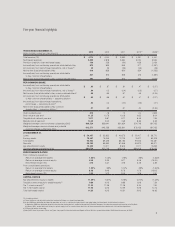
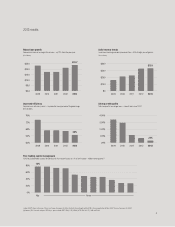
Five-year financial highlights
YEAR ENDED DECEMBER 31,
(dollars in millions, except per share amounts) 2013 2012 2011 2010
(a) 2009
(a)
Total revenue (TE) $ 4,114 $ 4,144 $ 3,980 $ 4,491 $ 4,441
Noninterest expense 2,820 2,818 2,684 3,034 3,554
Provision (credit) for loan and lease losses 130 229 (60) 638 3,15 9
Income (loss) from continuing operations attributable to Key 870 835 955 577 (1,287)
Income (loss) from discontinued operations, net of taxes(b) 40 23 (35)(23)(48)
Net income (loss) attributable to Key 910 858 920 554 (1,335)
Income (loss) from continuing operations attributable
to Key common shareholders 847 813 848 413 (1,581)
Net income (loss) attributable to Key common shareholders 887 836 813 390 (1,629)
PER COMMON SHARE
Income (loss) from continuing operations attributable
to Key common shareholders $ .93 $ .87 $ .91 $ .47 $ (2.27)
Income (loss) from discontinued operations, net of taxes(b) .04 .02 (.04)(.03)(.07)
Net income (loss) attributable to Key common shareholders(c) .98 .89 .87 .45 (2.34)
Income (loss) from continuing operations attributable
to Key common shareholders — assuming dilution $ .93 $ .86 $ .91 $ .47 $ (2.27)
Income (loss) from discontinued operations,
net of taxes — assuming dilution(b) .04 .02 (.04)(.03)(.07)
Net income (loss) attributable to Key common
shareholders — assuming dilution(c) .97 .89 .87 .44 (2.34)
Cash dividends paid .215 .18 .10 .04 .0925
Book value at year end 11.25 10.78 10.09 9.52 9.04
Tangible book value at year end 10.11 9.67 9.11 8.45 7.9 4
Market price at year end 13.42 8.42 7.6 9 8.85 5.55
Weighted-average common shares outstanding (000) 906,524 938,941 931,934 874,748 697,155
Weighted-average common shares and potential
common shares outstanding (000) 912,571 943,259 935,801 878,15 3 6 9 7,15 5
AT DECEMBER 31,
Loans $ 54,457 $ 52,822 $ 49,575 $ 5 0,107 $ 58,770
Earning assets 79,467 75,055 73,729 76,211 80,318
Total assets 92,934 89,236 88,785 91,843 93,287
Deposits 69,262 65,993 61,956 60,610 65,571
Key shareholders’ equity 10,303 10,271 9,905 11,117 10,663
Common shares outstanding (000) 890,724 925,769 953,008 880,608 878,535
PERFORMANCE RATIOS
From continuing operations
Return on average total assets 1.03 % 1.03 % 1.16 % .66 % (1.35)%
Return on average common equity 8.48 8.25 9.17 5.06 (19.00)
Net interest margin (TE) 3.12 3.21 3.16 3.26 2.83
From consolidated operations
Return on average total assets 1.02 % .99 % 1.04 % .59 % (1.34)%
Return on average common equity 8.88 8.48 8.79 4.78 (19.62)
Net interest margin (TE) 3.02 3.13 3.09 3.16 2.81
CAPITAL RATIOS
Key shareholders’ equity to assets 11.09 %11.51 %11.16 %12.10 % 11.43 %
Tangible common equity to tangible assets(d) 9.80 10.15 9.88 8.19 7.5 6
Tier 1 common equity(d) 11.22 11. 3 6 11.26 9.34 7. 50
Tier 1 risk-based capital 11.96 12.15 12.99 15.16 12.75
Total risk-based capital 14.33 15.13 16.51 19.12 16.95
TE = taxable equivalent.
(a) Financial data was not adjusted to reflect the treatment of Victory as a discontinued operation.
(b)
In April 2009, we decided to wind down the operations of Austin, a subsidiary that specialized in managing hedge fund investments for institutional customers.
In September 2009, we decided to discontinue the education lending business conducted through Key Education Resources, the education payment and financing unit of KeyBank.
In February 2013, we decided to sell Victory to a private equity fund. As a result of these decisions, we have accounted for these businesses as discontinued operations.
(c) EPS may not foot due to rounding.
(d) Non-GAAP financial measures. Please see Figure 4 on page 42 of the attached Annual Report on Form 10-K for a reconciliation of Non-GAAP financial measures to GAAP.
2