Johnson and Johnson 2012 Annual Report Download - page 16
Download and view the complete annual report
Please find page 16 of the 2012 Johnson and Johnson annual report below. You can navigate through the pages in the report by either clicking on the pages listed below, or by using the keyword search tool below to find specific information within the annual report.-
 1
1 -
2
-
3
-
4
-
5
-
 6
6 -
 7
7 -
 8
8 -
 9
9 -
 10
10 -
 11
11 -
 12
12 -
 13
13 -
 14
14 -
 15
15 -
 16
16 -
 17
17 -
 18
18 -
 19
19 -
 20
20 -
 21
21 -
 22
22 -
 23
23 -
 24
24 -
 25
25 -
 26
26 -
27
-
28
-
29
-
30
-
31
-
32
-
33
-
34
-
35
-
36
-
37
-
38
-
39
-
40
-
41
-
42
-
43
-
44
-
45
-
46
-
47
-
48
-
49
-
50
-
51
-
52
-
53
-
54
-
55
-
56
-
57
-
58
-
59
-
60
-
61
-
62
-
63
-
64
-
65
-
66
-
67
-
68
-
69
-
70
-
71
-
72
-
73
-
74
-
75
-
76
-
77
-
78
-
79
-
80
-
81
-
82
-
83
 |
 |

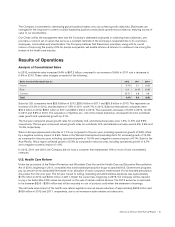
The Medical Devices and Diagnostics segment achieved sales of $25.8 billion in 2011, representing an increase of 4.8%
over the prior year, with operational growth of 1.7% and a positive currency impact of 3.1%. U.S. sales were $11.4 billion,
a decrease of 0.4% as compared to the prior year. International sales were $14.4 billion, an increase of 9.2% over the
prior year, with operational growth of 3.4% and a positive currency impact of 5.8%.
Analysis of Consolidated Earnings Before Provision for Taxes on
Income
Consolidated earnings before provision for taxes on income increased by $1.4 billion to $13.8 billion in 2012 as
compared to $12.4 billion in 2011, an increase of 11.4%. Earnings before provision for taxes on income were favorable
due to increased gross profit of $0.9 billion, a $0.1 billion decrease in selling, marketing and administrative expenses due
to cost containment initiatives across many of the businesses, lower litigation expense of $2.1 billion and lower charges of
$0.4 billion related to the DePuy ASR™ Hip program versus the prior year. This was partially offset by $2.1 billion of
charges attributable to asset write-downs and impairment of in-process research and development, primarily related to the
Crucell vaccine business and the discontinuation of the Phase III clinical development of bapineuzumab IV and $0.2 billion
of integration and currency costs related to the acquisition of Synthes, Inc., versus the prior year. Included in 2011 was a
$0.6 billion restructuring charge, net of inventory write-offs which are included in cost of products sold, related to the
Cardiovascular Care business. Additionally, 2011 included higher gains from divestitures and other items of $0.3 billion,
recorded in other (income) expense, net.
The 2011 decrease of 27.1% as compared to 2010 was primarily due to costs associated with litigation, which includes
product liability, the impact of the OTC and DePuy ASR™ Hip recalls and the restructuring expense related to the
Cardiovascular Care business. Additionally, investment spending, the fee on branded pharmaceutical products incurred
due to the U.S. health care reform legislation, and the integration costs, including an inventory step-up charge, associated
with the acquisition of Crucell contributed to the decrease in earnings. This was partially offset by gains from divestitures.
As a percent to sales, consolidated earnings before provision for taxes on income in 2012 was 20.5% versus 19.0% in
2011.
Cost of Products Sold and Selling, Marketing and Administrative Expenses: Cost of products sold and selling,
marketing and administrative expenses as a percent to sales were as follows:
% of Sales 2012 2011 2010
Cost of products sold 32.2% 31.3 30.5
Percent point increase over the prior year 0.9 0.8 0.7
Selling, marketing and administrative expenses 31.0 32.3 31.5
Percent point (decrease)/increase over the prior year (1.3) 0.8 (0.5)
In 2012, cost of products sold as a percent to sales increased compared to the prior year. This was primarily the result of
the amortization of the inventory step-up charge of $0.4 billion and amortization of intangibles related to the Synthes, Inc.,
acquisition of $0.3 billion and ongoing remediation costs in the McNeil OTC business. There was a decrease in the
percent to sales of selling, marketing and administrative expenses in 2012 compared to the prior year primarily due to cost
containment initiatives across many of the businesses. The prior year period included higher investment spending in the
Pharmaceutical business for new products.
In 2011, cost of products sold as a percent to sales increased compared to the prior year. This was primarily attributable
to ongoing remediation costs in the McNeil OTC business and inventory write-offs due to the restructuring of the
Cardiovascular Care business. In addition, lower margins and integration costs, including an inventory step-up charge,
associated with the acquisition of Crucell negatively impacted cost of products sold. Percent to sales of selling, marketing
and administrative expenses increased in 2011 compared to the prior year primarily due to investment spending, as well as
the fee on branded pharmaceutical products incurred due to the U.S. health care reform legislation.
8•Johnson & Johnson 2012 Annual Report