Johnson and Johnson 2012 Annual Report Download - page 12
Download and view the complete annual report
Please find page 12 of the 2012 Johnson and Johnson annual report below. You can navigate through the pages in the report by either clicking on the pages listed below, or by using the keyword search tool below to find specific information within the annual report.-
 1
1 -
 2
2 -
 3
3 -
 4
4 -
 5
5 -
 6
6 -
 7
7 -
 8
8 -
 9
9 -
 10
10 -
 11
11 -
 12
12 -
 13
13 -
 14
14 -
 15
15 -
 16
16 -
 17
17 -
 18
18 -
 19
19 -
 20
20 -
 21
21 -
 22
22 -
23
-
24
-
25
-
26
-
27
-
28
-
29
-
30
-
31
-
32
-
33
-
34
-
35
-
36
-
37
-
38
-
39
-
40
-
41
-
42
-
43
-
44
-
45
-
46
-
47
-
48
-
49
-
50
-
51
-
52
-
53
-
54
-
55
-
56
-
57
-
58
-
59
-
60
-
61
-
62
-
63
-
64
-
65
-
66
-
67
-
68
-
69
-
70
-
71
-
72
-
73
-
74
-
75
-
76
-
77
-
78
-
79
-
80
-
81
-
82
-
83
 |
 |

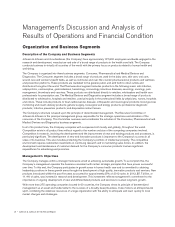
Analysis of Sales by Business Segments
Consumer Segment
Consumer segment sales in 2012 were $14.4 billion, a decrease of 2.9% from 2011, which included 0.5% operational
growth offset by a negative currency impact of 3.4%. U.S. Consumer segment sales were $5.0 billion, a decrease of
2.0%. International sales were $9.4 billion, a decrease of 3.4%, which included 1.9% operational growth offset by a
negative currency impact of 5.3%.
Major Consumer Franchise Sales:
% Change
(Dollars in Millions) 2012 2011 2010 ’12 vs. ’11 ’11 vs. ’10
OTC Pharmaceuticals & Nutritionals $4,354 4,402 4,549 (1.1)% (3.2)
Skin Care 3,618 3,715 3,452 (2.6) 7.6
Baby Care 2,254 2,340 2,209 (3.7) 5.9
Women’s Health 1,625 1,792 1,844 (9.3) (2.8)
Oral Care 1,624 1,624 1,526 0.0 6.4
Wound Care/Other 972 1,010 1,010 (3.8) 0.0
Total Consumer Sales $14,447 14,883 14,590 (2.9)% 2.0
The Over-the-Counter (OTC) Pharmaceuticals and Nutritionals franchise sales were $4.4 billion, a decrease of 1.1% from
2011. Sales in the U.S. decreased primarily due to lower sales of analgesics as a result of supply constraints and
competitive pressures in nutritional products. Strong growth of upper respiratory, digestive health and analgesics products
outside the U.S. was offset by negative currency.
McNEIL-PPC, Inc., continues to operate under a consent decree signed in 2011, with the U.S. Food and Drug
Administration (FDA), which governs certain McNeil Consumer Healthcare manufacturing operations. McNeil continues to
operate the manufacturing facilities in Las Piedras, Puerto Rico and Lancaster, Pennsylvania; however, production volumes
from these facilities continue to be impacted by additional review and approval processes required under the consent
decree. The Company expects this to continue throughout most of 2013. Plants operating under the consent decree will
produce a simplified portfolio focused on key brands. The Fort Washington, Pennsylvania manufacturing site is not in
operation at this time. McNeil continues to work on the re-siting of the products previously produced at the Fort
Washington facility to other facilities.
The Skin Care franchise sales were $3.6 billion in 2012, a decrease of 2.6% from 2011. Increased sales of
NEUTROGENA®products in the U.S. were offset by competition and economic conditions outside the U.S. The Baby
Care franchise sales were $2.3 billion, a decrease of 3.7% from 2011. The decline in U.S. sales and the impact of
negative currency was partially offset by increased sales of haircare and wipes outside the U.S. The Women’s Health
franchise sales were $1.6 billion, a decrease of 9.3% primarily due to the impact of the divestiture of certain brands. The
Oral Care franchise sales were flat as compared to the prior year. Increased sales of LISTERINE®products outside the
U.S. were partially offset by competitive pressures in the U.S. The Wound Care/Other franchise sales were $1.0 billion in
2012, a decrease of 3.8% from 2011 due to divestitures and competitive pressures. Negative currency impacted all of the
franchises.
Consumer segment sales in 2011 were $14.9 billion, an increase of 2.0% from 2010, a 0.7% operational decline was
offset by a positive currency impact of 2.7%. U.S. Consumer segment sales were $5.2 billion, a decrease of 6.7%.
International sales were $9.7 billion, an increase of 7.3%, which included 2.9% operational growth and a positive currency
impact of 4.4%.
4•Johnson & Johnson 2012 Annual Report