Johnson and Johnson 2012 Annual Report Download - page 11
Download and view the complete annual report
Please find page 11 of the 2012 Johnson and Johnson annual report below. You can navigate through the pages in the report by either clicking on the pages listed below, or by using the keyword search tool below to find specific information within the annual report.-
 1
1 -
 2
2 -
 3
3 -
 4
4 -
 5
5 -
 6
6 -
 7
7 -
 8
8 -
 9
9 -
 10
10 -
 11
11 -
 12
12 -
 13
13 -
 14
14 -
 15
15 -
 16
16 -
 17
17 -
 18
18 -
 19
19 -
 20
20 -
 21
21 -
 22
22 -
23
-
24
-
25
-
26
-
27
-
28
-
29
-
30
-
31
-
32
-
33
-
34
-
35
-
36
-
37
-
38
-
39
-
40
-
41
-
42
-
43
-
44
-
45
-
46
-
47
-
48
-
49
-
50
-
51
-
52
-
53
-
54
-
55
-
56
-
57
-
58
-
59
-
60
-
61
-
62
-
63
-
64
-
65
-
66
-
67
-
68
-
69
-
70
-
71
-
72
-
73
-
74
-
75
-
76
-
77
-
78
-
79
-
80
-
81
-
82
-
83
 |
 |

The Company is committed to developing global business leaders who can achieve growth objectives. Businesses are
managed for the long-term in order to sustain leadership positions and achieve growth that provides an enduring source of
value to our shareholders.
Our Credo unifies the management team and the Company’s dedicated employees in achieving these objectives, and
provides a common set of values that serve as a constant reminder of the Company’s responsibilities to its customers,
employees, communities and shareholders. The Company believes that these basic principles, along with its overall
mission of improving the quality of life for people everywhere, will enable Johnson & Johnson to continue to be among the
leaders in the health care industry.
Results of Operations
Analysis of Consolidated Sales
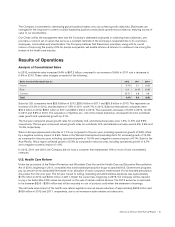
In 2012, worldwide sales increased 3.4% to $67.2 billion, compared to an increase of 5.6% in 2011 and a decrease of
0.5% in 2010. These sales changes consisted of the following:
Sales increase/(decrease) due to: 2012 2011 2010
Volume 5.7% 3.1 (0.5)
Price 0.4 (0.3) (0.8)
Currency (2.7) 2.8 0.8
Total 3.4% 5.6 (0.5)
Sales by U.S. companies were $29.8 billion in 2012, $28.9 billion in 2011 and $29.5 billion in 2010. This represents an
increase of 3.2% in 2012, and decreases of 1.8% in 2011 and 4.7% in 2010. Sales by international companies were
$37.4 billion in 2012, $36.1 billion in 2011 and $32.1 billion in 2010. This represents increases of 3.5% in 2012, 12.4%
in 2011 and 3.6% in 2010. The acquisition of Synthes, Inc., net of the related divestiture, increased both total worldwide
sales growth and operational growth by 3.1%.
The five-year compound annual growth rates for worldwide, U.S. and international sales were 1.9%, (1.7)% and 5.5%,
respectively. The ten-year compound annual growth rates for worldwide, U.S. and international sales were 6.4%, 2.9% and
10.4%, respectively.
Sales in Europe experienced a decline of 1.1% as compared to the prior year, including operational growth of 5.8% offset
by a negative currency impact of 6.9%. Sales in the Western Hemisphere (excluding the U.S.) achieved growth of 12.3%
as compared to the prior year, including operational growth of 19.0% and a negative currency impact of 6.7%. Sales in the
Asia-Pacific, Africa region achieved growth of 5.3% as compared to the prior year, including operational growth of 6.7%
and a negative currency impact of 1.4%.
In 2012, 2011 and 2010, the Company did not have a customer that represented 10% or more of total consolidated
revenues.
U.S. Health Care Reform
Under the provisions of the Patient Protection and Affordable Care Act and the Health Care and Education Reconciliation
Act of 2010, beginning in 2011, companies that sold branded prescription drugs to specified U.S. Government programs
pay an annual non-tax deductible fee based on an allocation of each company’s market share of total branded prescription
drug sales from the prior year. The full-year impact to selling, marketing and administrative expenses was approximately
$115 million in 2012 and $140 million in 2011. Under the current law, beginning in 2013, the Company will be required
to pay a tax deductible 2.3% excise tax imposed on the sale of certain medical devices. The 2013 excise tax is estimated
to be between $200 - $300 million and will be recorded in cost of products sold within the statement of earnings.
The net trade sales impact of the health care reform legislation was an annual reduction of approximately $450 million and
$425 million in 2012 and 2011, respectively, due to an increase in sales rebates and discounts.
Johnson & Johnson 2012 Annual Report •3