John Deere 2014 Annual Report Download - page 4
Download and view the complete annual report
Please find page 4 of the 2014 John Deere annual report below. You can navigate through the pages in the report by either clicking on the pages listed below, or by using the keyword search tool below to find specific information within the annual report.-
 1
1 -
 2
2 -
 3
3 -
 4
4 -
 5
5 -
 6
6 -
 7
7 -
 8
8 -
 9
9 -
 10
10 -
 11
11 -
 12
12 -
 13
13 -
 14
14 -
 15
15 -
16
-
17
-
18
-
19
-
20
-
21
-
22
-
23
-
24
-
25
-
26
-
27
-
28
-
29
-
30
-
31
-
32
-
33
-
34
-
35
-
36
-
37
-
38
-
39
-
40
-
41
-
42
-
43
-
44
-
45
-
46
-
47
-
48
-
49
-
50
-
51
-
52
-
53
-
54
-
55
-
56
-
57
-
58
-
59
-
60
-
61
-
62
-
63
-
64
-
65
-
66
-
67
-
68
 |
 |

4
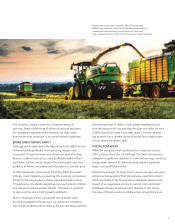
Though challenged by a weakening farm economy, John Deere
had another good year in 2014. We recorded our second-
highest-ever level of income, took further actions to expand our
worldwide presence, and continued an aggressive launch of
advanced new products. We also furthered our commitment to
being a responsible corporate citizen and leading employer.
Our results reected the skillful execution of our business plans,
which stress increasing our global customer base while keeping
a tight grip on costs and assets. As a result, we believe
the company is well-positioned to earn solid prots even in
a softer agricultural environment and, longer term, to benet
from sweeping trends that hold great promise.
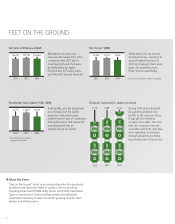
For the scal year, Deere reported income of $3.16 billion on net
sales and revenues of $36.1 billion. This represented a 5 percent
decline in sales and revenues and 11 percent lower income
compared with levels of 2013. Earnings per share were down as
well, but by only 5 percent, reecting the impact of fewer shares
outstanding due to continued share repurchases.
Last year’s results yielded healthy levels of economic prot, or
Shareholder Value Added* (SVA), meaning prots stayed well
above an underlying cost of capital. SVA – operating prot less
an implied capital charge – is the primary measure used in
managing the company and making investment decisions.
SVA was $2.69 billion for the year while cash ow from operations
totaled $3.53 billion. In addition to funding important projects,
these dollars allowed us to return a record amount to investors
through dividends and share repurchases. Since 2004,
the company has increased the quarterly dividend rate on 12
occasions and repurchased more than 200 million shares of stock.
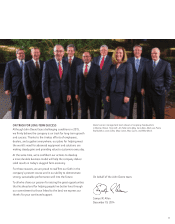
CHAIRMAN’S MESSAGE
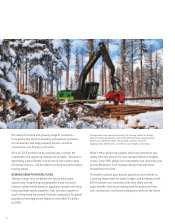
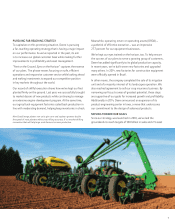
Production-class construction equipment such as the
new 350-horsepower 1050K crawler dozer, introduced
in late 2014, demonstrates Construction & Forestry’s
continued push into the large-equipment segment.
* SVA and OROA, referred to throughout this message, are non-GAAP nancial measures.
See page 15 for details.
Broad-Based Business Lineup,
Skillful Execution Lead to
Another Year of Solid Performance