John Deere 2012 Annual Report Download - page 17
Download and view the complete annual report
Please find page 17 of the 2012 John Deere annual report below. You can navigate through the pages in the report by either clicking on the pages listed below, or by using the keyword search tool below to find specific information within the annual report.-
 1
1 -
2
-
3
-
4
-
5
-
6
-
 7
7 -
 8
8 -
 9
9 -
 10
10 -
 11
11 -
 12
12 -
 13
13 -
 14
14 -
 15
15 -
 16
16 -
 17
17 -
 18
18 -
 19
19 -
 20
20 -
 21
21 -
 22
22 -
 23
23 -
 24
24 -
 25
25 -
 26
26 -
 27
27 -
28
-
29
-
30
-
31
-
32
-
33
-
34
-
35
-
36
-
37
-
38
-
39
-
40
-
41
-
42
-
43
-
44
-
45
-
46
-
47
-
48
-
49
-
50
-
51
-
52
-
53
-
54
-
55
-
56
-
57
-
58
-
59
-
60
 |
 |

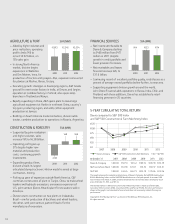
Worldwide Financial Services Operations
The operating profit of the financial services segment was
$725 million in 2011, compared with $499 million in 2010.
The increase in operating profit was primarily due to growth
in the credit portfolio and a lower provision for credit losses,
partially offset by narrower financing spreads. Results in 2010
were also affected by the write-down of wind energy assets that
were held for sale (see Note 4). Total revenues of the financial
services operations, including intercompany revenues, increased
3 percent in 2011, primarily reflecting the larger portfolio.
The average balance of receivables and leases financed was 13
percent higher in 2011, compared with 2010. Interest expense
decreased 7 percent in 2011 as a result of lower average
borrowing rates, partially offset by higher average borrowings.
The financial services operations’ ratio of earnings to fixed
charges was 2.22 to 1 in 2011, compared with 1.77 to 1 in 2010.
Equipment Operations in U.S. and Canada
The equipment operations in the U.S. and Canada had an
operating profit of $2,898 million in 2011, compared with
$2,302 million in 2010. The increase was due to higher
shipment volumes and improved price realization, partially
offset by increased raw material costs, higher manufacturing
overhead costs related to new products, increased selling,
administrative and general expenses and higher research and
development expenses. Net sales increased 17 percent primarily
due to higher shipment volumes and improved price realization.
The physical volume of sales increased 12 percent, compared
with 2010.
Equipment Operations outside U.S. and Canada
The equipment operations outside the U.S. and Canada had
an operating profit of $941 million in 2011, compared with
$607 million in 2010. The increase was primarily due to the
effects of higher shipment volumes and improved price
realization, partially offset by higher raw material costs, higher
manufacturing overhead costs related to new products, increased
selling, administrative and general expenses and higher research
and development costs. Net sales were 38 percent higher
primarily reflecting increased volumes and the effect of foreign
currency translation. The physical volume of sales increased 30
percent, compared with 2010.
CAPITAL RESOURCES AND LIQUIDITY
The discussion of capital resources and liquidity has been
organized to review separately, where appropriate, the company’s
consolidated totals, equipment operations and financial services
operations.
CONSOLIDATED
Positive cash flows from consolidated operating activities in
2012 were $1,168 million. This resulted primarily from net
income adjusted for non-cash provisions and an increase in
accounts payable and accrued expenses, which were partially
offset by an increase in trade receivables, inventories and
insurance receivables. Cash outflows from investing activities
were $4,004 million in 2012, primarily due to the cost of
receivables (excluding receivables related to sales) and equip-
ment on operating leases exceeding the collections of
receivables and the proceeds from sales of equipment on
operating leases by $2,076 million, purchases of property and
equipment of $1,319 million and purchases exceeding maturi-
ties and sales of marketable securities by $682 million. Cash
inflows from financing activities were $3,880 million in 2012
primarily due to an increase in borrowings of $6,141 million,
partially offset by repurchases of common stock of $1,588
million and dividends paid of $698 million. Cash and cash
equivalents increased $1,005 million during 2012.
Over the last three years, operating activities have
provided an aggregate of $5,776 million in cash. In addition,
increases in borrowings were $8,050 million, proceeds from
sales of businesses were $976 million, proceeds from issuance
of common stock (resulting from the exercise of stock options)
were $360 million. The aggregate amount of these cash flows
was used mainly to acquire receivables (excluding receivables
related to sales) and equipment on operating leases that
exceeded collections of receivables and the proceeds from sales
of equipment on operating leases by $5,199 million, repurchase
common stock of $3,614 million, purchase property and
equipment of $3,138 million, pay dividends of $1,775 million
and purchase marketable securities that exceeded proceeds from
maturities and sales by $1,261 million. Cash and cash equiva-
lents remained approximately the same as three years ago.
Given the continued uncertainty in the global economy,
there has been a reduction in liquidity in some global markets
that continues to affect the funding activities of the company.
However, the company has access to most global markets at a
reasonable cost and expects to have sufficient sources of global
funding and liquidity to meet its funding needs. The company’s
exposures to receivables from customers in European countries
experiencing economic strains are not significant. Sources of
liquidity for the company include cash and cash equivalents,
marketable securities, funds from operations, the issuance of
commercial paper and term debt, the securitization of retail
notes (both public and private markets) and committed and
uncommitted bank lines of credit. The company’s commercial
paper outstanding at October 31, 2012 and 2011 was $1,207
million and $1,279 million, respectively, while the total cash
and cash equivalents and marketable securities position was
$6,123 million and $4,435 million, respectively. The amount
of the total cash and cash equivalents and marketable securities
held by foreign subsidiaries, in which earnings are considered
indefinitely reinvested, was $628 million and $720 million at
October 31, 2012 and 2011, respectively.
17