John Deere 2012 Annual Report Download - page 14
Download and view the complete annual report
Please find page 14 of the 2012 John Deere annual report below. You can navigate through the pages in the report by either clicking on the pages listed below, or by using the keyword search tool below to find specific information within the annual report.-
 1
1 -
2
-
3
-
 4
4 -
 5
5 -
 6
6 -
 7
7 -
 8
8 -
 9
9 -
 10
10 -
 11
11 -
 12
12 -
 13
13 -
 14
14 -
 15
15 -
 16
16 -
 17
17 -
 18
18 -
 19
19 -
 20
20 -
 21
21 -
 22
22 -
 23
23 -
 24
24 -
25
-
26
-
27
-
28
-
29
-
30
-
31
-
32
-
33
-
34
-
35
-
36
-
37
-
38
-
39
-
40
-
41
-
42
-
43
-
44
-
45
-
46
-
47
-
48
-
49
-
50
-
51
-
52
-
53
-
54
-
55
-
56
-
57
-
58
-
59
-
60
 |
 |

Equipment Operations outside U.S. and Canada
The equipment operations outside the U.S. and Canada had
an operating profit of $561 million in 2012, compared with
$941 million in 2011. The decrease was primarily due to higher
production and raw material costs, the unfavorable effects of
foreign currency exchange, increased selling, administrative and
general expenses and higher research and development expenses,
partially offset by the effects of higher shipment volumes and
improved price realization. Net sales were 5 percent higher
primarily reflecting increased shipment volumes and price
realization, partially offset by the effect of foreign currency
translation. The physical volume of sales increased 7 percent,
compared with 2011.
MARKET CONDITIONS AND OUTLOOK
Company equipment sales are projected to increase by about
5 percent for fiscal year 2013 and about 10 percent for the first
quarter, compared with the same periods of 2012. For fiscal year
2013, net income attributable to Deere & Company is anticipated
to be approximately $3.2 billion.
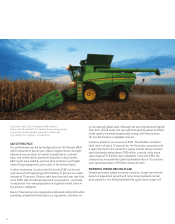
Agriculture and Turf.
The company’s worldwide sales of
agriculture and turf equipment are forecast to increase by about
4 percent for fiscal year 2013. Relatively high commodity
prices and strong farm incomes are expected to continue
supporting a favorable level of demand for farm machinery
during the year. The company’s sales are expected to benefit
from global expansion and lines of advanced new equipment.
Industry sales for agricultural machinery in the U.S. and
Canada are forecast to be about the same for 2013 in relation
to the prior year’s healthy levels. Caution around the U.S.
livestock and dairy sectors is expected to offset continued
strength in demand for large equipment, such as high horse-
power tractors.
Fiscal year industry sales in the EU27 are forecast to be
about the same to 5 percent lower due to continuing deteriora-
tion in the overall economy and a poor harvest in the U.K.
Sales in the Commonwealth of Independent States are expected
to be modestly higher in 2013. In South America, industry sales
are projected to increase about 10 percent as a result of favor-
able commodity prices and increased planting intentions.
Industry sales in Asia are projected to be approximately the
same as 2012 due to softer economic conditions in India and
China.
U.S. and Canada industry sales of turf and utility
equipment are expected to increase about 5 percent for
2013, reflecting some improvement in the U.S. economy.
The company’s sales are expected to increase more than the
industry due to the impact of new products.
Construction and Forestry.
The company’s worldwide sales
of construction and forestry equipment are forecast to increase
by about 8 percent for fiscal year 2013 due in part to modest
improvement in U.S. economic conditions. Sales in world
forestry markets are projected to be about the same for the
year as further weakness in European markets offsets stronger
demand in the U.S.
Financial Services.
Fiscal year 2013 net income attributable
to Deere & Company for the financial services operations is
expected to be approximately $500 million. The forecast
improvement is primarily due to expected growth in the credit
portfolio and lower crop insurance claims. These factors are
projected to be partially offset by an increase in the provision
for credit losses, which is anticipated to return to a more
typical level.
SAFE HARBOR STATEMENT
Safe Harbor Statement under the Private Securities Litigation Reform
Act of 1995: Statements under “Overview,” “Market
Conditions and Outlook,” and other forward-looking state-
ments herein that relate to future events, expectations, trends
and operating periods involve certain factors that are subject to
change, and important risks and uncertainties that could cause
actual results to differ materially. Some of these risks and
uncertainties could affect particular lines of business, while
others could affect all of the company’s businesses.
The company’s agricultural equipment business is subject
to a number of uncertainties including the many interrelated
factors that affect farmers’ confidence. These factors include
worldwide economic conditions, demand for agricultural
products, world grain stocks, weather conditions (including its
effects on timely planting and harvesting), soil conditions
(including low subsoil moisture from recent drought conditions),
harvest yields, prices for commodities and livestock, crop and
livestock production expenses, availability of transport for crops,
the growth of non-food uses for some crops (including ethanol
and biodiesel production), real estate values, available acreage
for farming, the land ownership policies of various govern-
ments, changes in government farm programs and policies
(including those in Argentina, Brazil, China, the European
Union, India, Russia and the U.S.), international reaction
to such programs, changes in and effects of crop insurance
programs, global trade agreements, animal diseases and their
effects on poultry, beef and pork consumption and prices,
crop pests and diseases, and the level of farm product exports
(including concerns about genetically modified organisms).
Factors affecting the outlook for the company’s turf
and utility equipment include general economic conditions,
consumer confidence, weather conditions, customer profitabil-
ity, consumer borrowing patterns, consumer purchasing
preferences, housing starts, infrastructure investment, spending
by municipalities and golf courses, and consumable input costs.
14