John Deere 2012 Annual Report Download - page 12
Download and view the complete annual report
Please find page 12 of the 2012 John Deere annual report below. You can navigate through the pages in the report by either clicking on the pages listed below, or by using the keyword search tool below to find specific information within the annual report.-
 1
1 -
 2
2 -
 3
3 -
 4
4 -
 5
5 -
 6
6 -
 7
7 -
 8
8 -
 9
9 -
 10
10 -
 11
11 -
 12
12 -
 13
13 -
 14
14 -
 15
15 -
 16
16 -
 17
17 -
 18
18 -
 19
19 -
 20
20 -
 21
21 -
 22
22 -
23
-
24
-
25
-
26
-
27
-
28
-
29
-
30
-
31
-
32
-
33
-
34
-
35
-
36
-
37
-
38
-
39
-
40
-
41
-
42
-
43
-
44
-
45
-
46
-
47
-
48
-
49
-
50
-
51
-
52
-
53
-
54
-
55
-
56
-
57
-
58
-
59
-
60
 |
 |

MANAGEMENT’S DISCUSSION AND ANALYSIS
RESULTS OF OPERATIONS FOR THE YEARS ENDED
OCTOBER 31, 2012, 2011 AND 2010
OVERVIEW
Organization
The company’s equipment operations generate revenues and
cash primarily from the sale of equipment to John Deere dealers
and distributors. The equipment operations manufacture and
distribute a full line of agricultural equipment; a variety of
commercial, consumer and landscapes equipment and products;
and a broad range of equipment for construction and forestry.
The company’s financial services primarily provide credit
services, which mainly finance sales and leases of equipment by
John Deere dealers and trade receivables purchased from the
equipment operations. In addition, financial services offer crop
risk mitigation products and extended equipment warranties.
The information in the following discussion is presented in a
format that includes information grouped as consolidated,
equipment operations and financial services. The company also
views its operations as consisting of two geographic areas, the
U.S. and Canada, and outside the U.S. and Canada. The
company’s operating segments consist of agriculture and turf,
construction and forestry, and financial services.
Trends and Economic Conditions
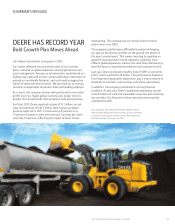
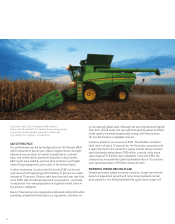
The company’s agriculture and turf equipment sales increased
13 percent in 2012 and are forecast to increase by about 4
percent for 2013. Industry agricultural machinery sales in the
U.S. and Canada for 2013 are forecast to remain approximately
the same, compared to healthy levels in 2012. Industry sales in
the European Union (EU)27 nations of Western and Central
Europe are forecast to be about the same to 5 percent lower in
2013, while sales in the Commonwealth of Independent States
are expected to be modestly higher. South American industry
sales are projected to increase approximately 10 percent in
2013. Industry sales in Asia are forecast to be about the same in
2013. Industry sales of turf and utility equipment in the U.S.
and Canada are expected to increase approximately 5 percent.
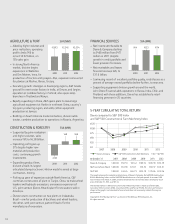
The company’s construction and forestry sales increased 19
percent in 2012 and are forecast to increase by about 8 percent
in 2013. Sales in world forestry markets are expected to be
approximately the same in 2013. Net income of the company’s
financial services operations attributable to Deere & Company
in 2013 is expected to be approximately $500 million.
Items of concern include the uncertainty of the effective-
ness of governmental actions in respect to monetary and fiscal
policies, the global economic recovery, the impact of sovereign
and state debt, capital market disruptions, trade agreements, the
availability of credit for the company’s customers and suppliers,
and financial regulatory reform. Drought conditions and
significant volatility in the price of many commodities could
also impact the company’s results. The availability of certain
components that could impact the company’s ability to meet
production schedules continues to be monitored. Designing and
producing products with engines that continue to meet high
performance standards and increasingly stringent emissions
regulations is one of the company’s major priorities.
The company remains well positioned to carry out its
growth plans and capitalize on positive long-term trends.
With support from employees, dealers and suppliers, the
company’s plans for helping meet the world’s growing need for
food and infrastructure are moving ahead successfully.
2012 COMPARED WITH 2011
CONSOLIDATED RESULTS
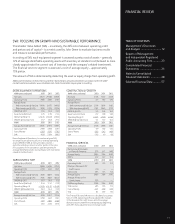
Worldwide net income attributable to Deere & Company in
2012 was $3,065 million, or $7.63 per share diluted ($7.72
basic), compared with $2,800 million, or $6.63 per share
diluted ($6.71 basic), in 2011. Net sales and revenues increased
13 percent to $36,157 million in 2012, compared with $32,013
million in 2011. Net sales of the equipment operations
increased 14 percent in 2012 to $33,501 million from $29,466
million last year. The sales increase included improved price
realization of 4 percent and an unfavorable foreign currency
translation effect of 3 percent. Net sales in the U.S. and Canada
increased 20 percent in 2012. Net sales outside the U.S. and
Canada increased by 5 percent in 2012, which included an
unfavorable effect of 6 percent for foreign currency translation.
Worldwide equipment operations had an operating profit
of $4,397 million in 2012, compared with $3,839 million in
2011. The higher operating profit was primarily due to the
impact of improved price realization and higher shipment
volumes, partially offset by higher production and raw material
costs, unfavorable effects of foreign currency exchange,
increased research and development expenses, higher selling,
administrative and general expenses and a goodwill impairment
charge (see Note 5). The increase in production costs related to
new products, engine emission requirements and incentive
compensation expenses.
The equipment operations’ net income was $2,616 million
in 2012, compared with $2,329 million in 2011. The same
operating factors mentioned above, as well as an increase in
the effective tax rate and interest expense affected these results.
Net income of the financial services operations attribut-
able to Deere & Company in 2012 decreased to $460 million,
compared with $471 million in 2011. The decrease was primarily
a result of increased selling, administrative and general expenses,
higher reserves for crop insurance claims and narrower financing
spreads, partially offset by growth in the credit portfolio and a
lower provision for credit losses. Additional information is
presented in the following discussion of the “Worldwide
Financial Services Operations.”
The cost of sales to net sales ratio for 2012 was 74.6 percent,
compared with 74.4 percent last year. The increase was primarily
due to higher production costs, increased raw material costs and
unfavorable effects of foreign currency exchange, partially offset
by improved price realization.
12