John Deere 2010 Annual Report Download - page 17
Download and view the complete annual report
Please find page 17 of the 2010 John Deere annual report below. You can navigate through the pages in the report by either clicking on the pages listed below, or by using the keyword search tool below to find specific information within the annual report.-
 1
1 -
2
-
3
-
4
-
5
-
6
-
 7
7 -
 8
8 -
 9
9 -
 10
10 -
 11
11 -
 12
12 -
 13
13 -
 14
14 -
 15
15 -
 16
16 -
 17
17 -
 18
18 -
 19
19 -
 20
20 -
 21
21 -
 22
22 -
 23
23 -
 24
24 -
 25
25 -
 26
26 -
 27
27 -
28
-
29
-
30
-
31
-
32
-
33
-
34
-
35
-
36
-
37
-
38
-
39
-
40
-
41
-
42
-
43
-
44
-
45
-
46
-
47
-
48
-
49
-
50
-
51
-
52
-
53
-
54
-
55
-
56
-
57
-
58
-
59
-
60
 |
 |

17
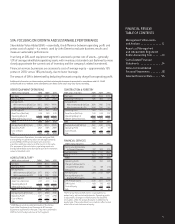
Equipment Operations in U.S. and Canada
The equipment operations in the U.S. and Canada had an
operating profi t of $1,129 million in 2009, compared with
$1,831 million in 2008. The decrease was primarily due to
lower shipment and production volumes, a goodwill impairment
charge, higher raw material costs and voluntary employee
separation expenses, partially offset by improved price realization
and decreased selling, administrative and general expenses.
Net sales decreased 14 percent due to lower volumes and the
unfavorable effects of currency translation, partially offset by
improved price realization. The physical volume decreased
18 percent, compared with 2008.
Equipment Operations outside U.S. and Canada
The equipment operations outside the U.S. and Canada had
an operating profi t of $236 million in 2009, compared with
$1,096 million in 2008. The decrease was primarily due to the
effects of lower shipment and production volumes, unfavorable
effects of foreign currency exchange rates and increases in raw
material costs, partially offset by improved price realization and
decreased selling, administrative and general expenses. Net sales
were 28 percent lower refl ecting lower volumes and the effect
of currency translation, partially offset by improvements in price
realization. The physical volume decreased 26 percent, compared
with 2008.
CAPITAL RESOURCES AND LIQUIDITY
The discussion of capital resources and liquidity has been
organized to review separately, where appropriate, the company’s
consolidated totals, Equipment Operations and Financial
Services operations.
CONSOLIDATED
Positive cash fl ows from consolidated operating activities in
2010 were $2,282 million. This resulted primarily from net
income adjusted for non-cash provisions and an increase in
accounts payable and accrued expenses, which were partially
offset by an increase in trade receivables and inventories.
Cash outfl ows from investing activities were $2,109 million in
2010, primarily due to the cost of receivables and equipment
on operating leases exceeding the collections of receivables and
the proceeds from sales of equipment on operating leases by
$1,376 million and purchases of property and equipment of
$762 million. Cash outfl ows from fi nancing activities were
$1,010 million in 2010 primarily due to dividends paid of
$484 million, repurchases of common stock of $359 million
and a decrease in borrowings of $299 million, which were
partially offset by proceeds from issuance of common stock
of $129 million (resulting from the exercise of stock options).
Cash and cash equivalents decreased $861 million during 2010.
Over the last three years, operating activities have
provided an aggregate of $6,216 million in cash. In addition,
increases in borrowings were $2,091 million, proceeds from
maturities and sales of marketable securities exceeded purchases
by $1,368 million and proceeds from issuance of common stock
were $255 million. The aggregate amount of these cash fl ows
was used mainly to purchase property and equipment of
$2,781 million, repurchase common stock of $2,040 million,
acquire receivables and equipment on operating leases that
exceeded collections and the proceeds from sales of equipment
on operating leases by $2,008 million, pay dividends to stock-
holders of $1,405 million and acquire businesses for $348 million.
Cash and cash equivalents also increased $1,512 million over
the three-year period.
Given the continued volatility in the global economy,
there has been a reduction in liquidity in some global markets
that continues to affect the funding activities of the company.
However, the company has access to most global markets at a
reasonable cost and expects to have suffi cient sources of global
funding and liquidity to meet its funding needs. Sources of
liquidity for the company include cash and cash equivalents,
marketable securities, funds from operations, the issuance of
commercial paper and term debt, the securitization of retail
notes (both public and private markets) and committed and
uncommitted bank lines of credit. The company’s commercial
paper outstanding at October 31, 2010 and 2009 was
$2,028 million and $286 million, respectively, while the total
cash and cash equivalents and marketable securities position
was $4,019 million and $4,844 million, respectively.
Lines of Credit. The company also has access to bank lines
of credit with various banks throughout the world. Some of
the lines are available to both Deere & Company and Capital
Corporation. Worldwide lines of credit totaled $5,294 million
at October 31, 2010, $3,222 million of which were unused.
For the purpose of computing unused credit lines, commercial
paper and short-term bank borrowings, excluding secured
borrowings and the current portion of long-term borrowings,
were primarily considered to constitute utilization. Included in
the total credit lines at October 31, 2010 was a long-term credit
facility agreement of $3,750 million, expiring in February 2012,
and a long-term credit facility agreement of $1,500 million,
expiring in April 2013. These credit agreements require
Capital Corporation to maintain its consolidated ratio of
earnings to fi xed charges at not less than 1.05 to 1 for each fi scal
quarter and the ratio of senior debt, excluding securitization
indebtedness, to capital base (total subordinated debt and
Capital Corporation stockholder’s equity excluding accumu-
lated other comprehensive income (loss)) at not more than
11 to 1 at the end of any fi scal quarter. The credit agreements
also require the Equipment Operations to maintain a ratio of
total debt to total capital (total debt and Deere & Company
stockholders’ equity excluding accumulated other comprehen-
sive income (loss)) of 65 percent or less at the end of each fi scal
quarter. Under this provision, the company’s excess equity
capacity and retained earnings balance free of restriction at
October 31, 2010 was $7,832 million. Alternatively under
this provision, the Equipment Operations had the capacity to
incur additional debt of $14,545 million at October 31, 2010.
All of these requirements of the credit agreements have been
met during the periods included in the consolidated fi nancial
statements.