John Deere 2010 Annual Report Download - page 13
Download and view the complete annual report
Please find page 13 of the 2010 John Deere annual report below. You can navigate through the pages in the report by either clicking on the pages listed below, or by using the keyword search tool below to find specific information within the annual report.-
 1
1 -
2
-
 3
3 -
 4
4 -
 5
5 -
 6
6 -
 7
7 -
 8
8 -
 9
9 -
 10
10 -
 11
11 -
 12
12 -
 13
13 -
 14
14 -
 15
15 -
 16
16 -
 17
17 -
 18
18 -
 19
19 -
 20
20 -
 21
21 -
 22
22 -
 23
23 -
24
-
25
-
26
-
27
-
28
-
29
-
30
-
31
-
32
-
33
-
34
-
35
-
36
-
37
-
38
-
39
-
40
-
41
-
42
-
43
-
44
-
45
-
46
-
47
-
48
-
49
-
50
-
51
-
52
-
53
-
54
-
55
-
56
-
57
-
58
-
59
-
60
 |
 |

13
Finance and interest income decreased this year due to
lower fi nancing rates, partially offset by a larger average portfolio.
Other income increased primarily as a result of an increase in
wind energy income, higher commissions from crop insurance
and higher service revenues. Research and development
expenses increased primarily as a result of increased spending in
support of new products including designing and producing
products with engines to meet more stringent emissions
regulations. Selling, administrative and general expenses
increased primarily due to increased incentive compensation
expenses, higher postretirement benefi t costs and the effect of
foreign currency translation. Interest expense decreased due to
lower average borrowing rates and lower average borrowings.
Other operating expenses increased primarily due to the
write-down of wind energy assets classifi ed as held for sale
(see Notes 4 and 30). The equity in income of unconsolidated
affi liates increased as a result of higher income from construction
equipment manufacturing affi liates due to increased levels of
construction activity.
The company has several defi ned benefi t pension plans
and defi ned benefi t health care and life insurance plans.
The company’s postretirement benefi t costs for these plans in
2010 were $658 million, compared with $312 million in 2009,
primarily due to a decrease in discount rates. The long-term
expected return on plan assets, which is refl ected in these costs,
was an expected gain of 8.2 percent in 2010 and 2009, or $883
million in 2010 and $857 million in 2009. The actual return
was a gain of $1,273 million in 2010 and $1,142 million in
2009. In 2011, the expected return will be approximately
8.0 percent. The company expects postretirement benefi t costs
in 2011 to be approximately the same as 2010. The company
makes any required contributions to the plan assets under
applicable regulations and voluntary contributions from time
to time based on the company’s liquidity and ability to make
tax-deductible contributions. Total company contributions to
the plans were $836 million in 2010 and $358 million in 2009,
which include direct benefi t payments for unfunded plans.
These contributions also included voluntary contributions to
total plan assets of approximately $650 million in 2010 and
$150 million in 2009. Total company contributions in 2011
are expected to be approximately $316 million, which include
direct benefi t payments. The company has no signifi cant
contributions to pension plan assets required in 2011 under
applicable funding regulations. See the following discussion of
“Critical Accounting Policies” for more information about
postretirement benefi t obligations.
BUSINESS SEGMENT AND GEOGRAPHIC AREA RESULTS
The following discussion relates to operating results by report-
able segment and geographic area. Operating profi t is income
before certain external interest expense, certain foreign
exchange gains or losses, income taxes and corporate expenses.
However, operating profi t of the credit segment includes the
effect of interest expense and foreign currency exchange gains
or losses.
Worldwide Agriculture and Turf Operations
The agriculture and turf segment had an operating profi t of
$2,790 million in 2010, compared with $1,448 million in 2009.
Net sales increased 10 percent this year primarily due to higher
production and shipment volumes. Sales also increased due to
foreign currency translation and improved price realization.
The increase in operating profi t was due to increased shipment
and production volumes, improved price realization, the
favorable effects of foreign currency exchange and lower raw
material costs, partially offset by higher postretirement benefi t
costs and increased incentive compensation expenses. Last year’s
results were affected by a goodwill impairment charge and
voluntary employee separation expenses.
Worldwide Construction and Forestry Operations
The construction and forestry segment had an operating profi t
of $119 million in 2010, compared with a loss of $83 million in
2009. Net sales increased 41 percent for the year due to higher
shipment and production volumes. The operating profi t
improvement in 2010 was primarily due to higher shipment and
production volumes, partially offset by higher postretirement
benefi t costs and increased incentive compensation expenses.
Worldwide Credit Operations
The operating profi t of the credit operations was $465 million
in 2010, compared with $223 million in 2009. The increase in
operating profi t was primarily due to improved fi nancing spreads
and a lower provision for credit losses. Total revenues of the
credit operations, including intercompany revenues, increased
1 percent in 2010, primarily refl ecting the larger portfolio.
The average balance of receivables and leases fi nanced was
5 percent higher in 2010, compared with 2009. Interest expense
decreased 28 percent in 2010 as a result of lower borrowing
rates and lower average borrowings. The credit operations’ ratio
of earnings to fi xed charges was 1.72 to 1 in 2010, compared
with 1.24 to 1 in 2009.
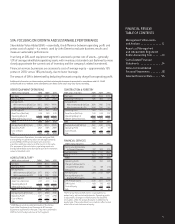
Equipment Operations in U.S. and Canada
The equipment operations in the U.S. and Canada had an
operating profi t of $2,302 million in 2010, compared with
$1,129 million in 2009. The increase was due to higher
shipment and production volumes, improved price realization
and lower raw material costs, partially offset by increased
postretirement benefi t costs and higher incentive compensation
expenses. Last year’s operating profi t was affected by a goodwill
impairment charge and voluntary employee separation expenses.
Net sales increased 14 percent primarily due to higher volumes
and improved price realization. The physical volume increased
10 percent, compared with 2009.
Equipment Operations outside U.S. and Canada
The equipment operations outside the U.S. and Canada had
an operating profi t of $607 million in 2010, compared with
$236 million in 2009. The increase was primarily due to the
effects of higher shipment and production volumes, the
favorable effects of foreign currency exchange rates, improved
price realization and decreases in raw material costs, partially
offset by higher incentive compensation expenses. Net sales
were 14 percent higher primarily refl ecting increased volumes
and the effect of foreign currency translation. The physical
volume increased 8 percent, compared with 2009.