John Deere 2010 Annual Report Download - page 11
Download and view the complete annual report
Please find page 11 of the 2010 John Deere annual report below. You can navigate through the pages in the report by either clicking on the pages listed below, or by using the keyword search tool below to find specific information within the annual report.-
 1
1 -
 2
2 -
 3
3 -
 4
4 -
 5
5 -
 6
6 -
 7
7 -
 8
8 -
 9
9 -
 10
10 -
 11
11 -
 12
12 -
 13
13 -
 14
14 -
 15
15 -
 16
16 -
 17
17 -
 18
18 -
 19
19 -
 20
20 -
 21
21 -
 22
22 -
23
-
24
-
25
-
26
-
27
-
28
-
29
-
30
-
31
-
32
-
33
-
34
-
35
-
36
-
37
-
38
-
39
-
40
-
41
-
42
-
43
-
44
-
45
-
46
-
47
-
48
-
49
-
50
-
51
-
52
-
53
-
54
-
55
-
56
-
57
-
58
-
59
-
60
 |
 |

Management’s Discussion
and Analysis ........................... 12
Reports of Management
and Independent Registered
Public Accounting Firm .......... 23
Consolidated Financial
Statements ........................... 24
Notes to Consolidated
Financial Statements ............. 28
Selected Financial Data .......... 56
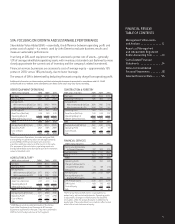
SVA: FOCUSING ON GROWTH AND SUSTAINABLE PERFORMANCE
Shareholder Value Added (SVA) – essentially, the difference between operating profi t and
pretax cost of capital – is a metric used by John Deere to evaluate business results and
measure sustainable performance.
In arriving at SVA, each equipment segment is assessed a pretax cost of assets – generally
12% of average identifi able operating assets with inventory at standard cost (believed to more
closely approximate the current cost of inventory and the company’s related investment).
Financial-services businesses are assessed a cost of average equity – approximately 15%
pretax in 2010, versus 18% previously, due to lower leverage.
The amount of SVA is determined by deducting the asset or equity charge from operating profi t.
Additional information on these metrics and their relationship to amounts presented in accordance with U.S. GAAP
can be found at our website, www.JohnDeere.com. Note: Some totals may vary due to rounding.
FINANCIAL REVIEW
TABLE OF CONTENTS
Deere Equipment Operations, to create and grow SVA,
are targeting an operating return on average operating
assets (OROA) of 20% at mid-cycle sales volumes –
and other ambitious returns at other points in the cycle.
(For purposes of this calculation, operating assets are
average identifi able assets during the year with inventories
valued at standard cost.)
DEERE EQUIPMENT OPERATIONS
$MM unless indicated 2008 2009 2010
Net Sales 25803 20756 23573
Operating Profi t 2927 1365 2909
Average Assets
With Inventories @ Std Cost 10812 10950 10494
With Inventories @ LIFO 9652 9647 9196
OROA % @ LIFO 30.3 14.1 31.6
Asset Turns (Std Cost) 2.39 1.90 2.25
Operating Margin % x 11.34 x 6.58 x 12.34
OROA % @ Standard Cost 27.1 12.5 27.7
$MM 2008 2009 2010
Average Assets @ Std Cost 10812 10950 10494
Operating Profi t 2927 1365 2909
Cost of Assets -1284 -1301 -1259
SVA 1643 64 1650
*2008 fi gures are the combined results of the former
Agricultural Equipment and Commercial & Consumer
Equipment segments for that year. They were combined in
2009 to form the Agriculture and Turf segment.
AGRICULTURE & TURF*
$MM unless indicated 2008* 2009 2010
Net Sales 20985 18122 19868
Operating Profi t 2461 1448 2790
Average Assets
With Inventories @ Std Cost 8171 8500 8138
With Inventories @ LIFO 7196 7397 7035
OROA % @ LIFO 34.2 19.6 39.7
Asset Turns (Std Cost) 2.57 2.13 2.44
Operating Margin % x 11.73 x 7.99 x 14.04
OROA % @ Standard Cost 30.1 17.0 34.3
$MM 2008* 2009 2010
Average Assets @ Std Cost 8171 8500 8138
Operating Profi t 2461 1448 2790
Cost of Assets -967 -1007 -977
SVA 1494 441 1813
CONSTRUCTION & FORESTRY
$MM unless indicated 2008 2009 2010
Net Sales 4818 2634 3705
Operating Profi t (Loss) 466 (83) 119
Average Assets
With Inventories @ Std Cost 2641 2450 2356
With Inventories @ LIFO 2456 2250 2161
OROA % @ LIFO 19.0 -3.7 5.5
Asset Turns (Std Cost) 1.82 1.08 1.57
Operating Margin % x 9.67 x -3.15 x 3.21
OROA % @ Standard Cost 17.6 -3.4 5.1
$MM 2008 2009 2010
Average Assets @ Std Cost 2641 2450 2356
Operating Profi t 466 -83 119
Cost of Assets -317 -294 -282
SVA 149 -377 -163
The Financial Services SVA metric is calculated on a
pretax basis, with certain adjustments. Operating profi t
is adjusted for changes in the allowance for doubtful
receivables, while the actual allowance is added to the
equity base. These adjustments are made to refl ect actual
write-offs in both income and equity.
FINANCIAL SERVICES
$MM unless indicated 2008 2009 2010
Net Income Attributable
to Deere & Company 337 203 373
Average Equity 2355 2732 3064
ROE % 14.3 7.4 12.2
$MM 2008 2009 2010
Operating Profi t 493 242 499
Change in Allowance for
Doubtful Receivables (4) 68 (14)
SVA Income 489 310 485
Average Equity 2355 2732 3064
Average Allowance for
Doubtful Receivables 183 195 232
SVA Average Equity 2538 2927 3296
SVA Income 489 310 485
Cost of Equity -430 -458 -421
SVA 59 -148 64
11