Jack In The Box 2014 Annual Report Download - page 6
Download and view the complete annual report
Please find page 6 of the 2014 Jack In The Box annual report below. You can navigate through the pages in the report by either clicking on the pages listed below, or by using the keyword search tool below to find specific information within the annual report.-
 1
1 -
 2
2 -
 3
3 -
 4
4 -
 5
5 -
 6
6 -
 7
7 -
 8
8 -
 9
9 -
 10
10 -
 11
11 -
 12
12 -
 13
13 -
 14
14 -
 15
15 -
 16
16 -
 17
17 -
18
-
19
-
20
-
21
-
22
-
23
-
24
-
25
-
26
-
27
-
28
-
29
-
30
-
31
-
32
-
33
-
34
-
35
-
36
-
37
-
38
-
39
-
40
-
41
-
42
-
43
-
44
-
45
-
46
-
47
-
48
-
49
-
50
-
51
-
52
-
53
-
54
-
55
-
56
-
57
-
58
-
59
-
60
-
61
-
62
-
63
-
64
-
65
-
66
-
67
-
68
-
69
-
70
-
71
-
72
-
73
-
74
-
75
-
76
-
77
-
78
-
79
-
80
-
81
-
82
-
83
-
84
-
85
-
86
-
87
-
88
-
89
-
90
-
91
-
92
-
93
-
94
-
95
-
96
 |
 |

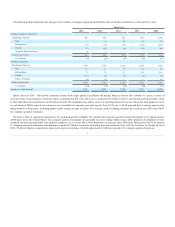
The following table summarizes the changes in the number of company-operated and franchise Qdoba restaurants over the past five years:
Company-operated restaurants:
Beginning of period
296
316
245
188
157
New
16
34
26
25
15
Refranchised
—
(3)
—
—
—
Acquired from franchisees
—
13
46
32
16
Closed
(2)
(64)
(1)
—
—
End of period total
310
296
316
245
188
% of system
49%
48%
50%
42%
36%
Franchise restaurants:
Beginning of period
319
311
338
337
353
New
22
34
32
42
21
Refranchised
—
3
—
—
—
Sold to Company
—
(13)
(46)
(32)
(16)
Closed
(13)
(16)
(13)
(9)
(21)
End of period total
328
319
311
338
337
% of system
51%
52%
50%
58%
64%
System end of period total
638
615
627
583
525
Site selections for all new company-operated Jack in the Box and Qdoba restaurants are made after an economic analysis and a review of demographic data
and other information relating to population density, traffic, competition, restaurant visibility and access, available parking, surrounding businesses and
opportunities for market penetration. Restaurants developed by franchisees are built to brand specifications on sites we have reviewed.
We have multiple restaurant models with different seating capacities to improve our flexibility in selecting locations for our restaurants. Management
believes that this flexibility enables the Company to match the restaurant configuration with the specific economic, demographic, geographic or physical
characteristics of a particular site. The majority of our Jack in the Box restaurants are constructed on leased land or on land that we purchased and
subsequently sold, along with the improvements, in a sale and leaseback transaction. Typical costs to develop a traditional Jack in the Box restaurant,
excluding the land value, range from $1.4 million to $1.9 million. Upon completion of a sale and leaseback transaction, the Company’s initial cash
investment is reduced to the cost of equipment, which ranges from approximately $0.3 million to $0.5 million.
The majority of Qdoba restaurants are located in leased spaces ranging from conventional large-scale retail projects to smaller neighborhood retail strip
centers as well as non-traditional locations such as airports, college campuses and food courts. Qdoba restaurant development costs typically range from $0.4
million to $1.1 million depending on the type, square footage and geographic region.
Jack in the Box. The Jack in the Box franchise agreement generally provides for an initial franchise fee of $50,000 per restaurant for a 20-year term and
marketing fees at 5% of gross sales. Royalty rates, typically 5% of gross sales, generally range from 2% to as high as 15% of gross sales, and some existing
agreements provide for variable rates and royalty holidays. We offer development agreements to franchisees for construction of one or more new restaurants
over a defined period of time and in a defined geographic area. Developers are required to pay a fee, which may be credited against a portion of the franchise
fee due when restaurants open in the future. Developers may forfeit such fees and lose their rights to future development if they do not maintain the required
schedule of openings. To stimulate growth we offer franchisees who opened restaurants within a specified time reduced franchise fees and lower royalty rates.
In connection with the sale of a company-operated restaurant, the restaurant equipment and the right to do business at that location are sold to the
franchisee. The aggregate price is negotiated based upon the value of the restaurant as a going concern, which depends on various factors, including the sales
and cash flows of the restaurant, as well as its location and history. In addition, the land and building are generally leased or subleased to the franchisee at a
negotiated rent, typically equal to the greater
4