Jack In The Box 2014 Annual Report Download - page 21
Download and view the complete annual report
Please find page 21 of the 2014 Jack In The Box annual report below. You can navigate through the pages in the report by either clicking on the pages listed below, or by using the keyword search tool below to find specific information within the annual report.
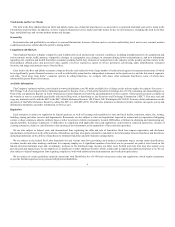
Performance Graph. The following graph compares the cumulative return to holders of the Company’s common stock at September 30th of each year to
the yearly weighted cumulative return of a Peer Group Index and to the Standard & Poor’s (“S&P”) 500 Index for the same period. As it does every year, the
Compensation Committee of the Board of Directors (the “Committee”) reviews the make-up of the Peer Group as part of its process of setting the
compensation of our executive officers. Working closely with its independent compensation consultant, and considering anticipated Company revenues, the
Committee approved changes to the 2014 Peer Group to remove Darden Restaurants, Inc. due to its size being substantially larger than the other members of
the Peer Group based on defined criteria (i.e., revenue, market capitalization, and systemwide sales), and added Buffalo Wild Wings, Inc., which more closely
meets the established criteria for our Peer Group.
The below comparison assumes $100 was invested on September 30, 2009 in the Company’s common stock and in the comparison groups and assumes
reinvestment of dividends. The Company paid dividends beginning in fiscal 2014.
Jack in the Box Inc. $100 $105 $97 $137 $195 $335
S&P 500 Index $100 $110 $111 $145 $173 $207
New Peer Group (1) $100 $135 $172 $224 $299 $378
Old Peer Group (2) $100 $134 $163 $212 $263 $330
____________________________
(1) The New Peer Group Index comprises the following companies: Brinker International, Inc.; Buffalo Wild Wings, Inc.; Chipotle Mexican Grill Inc.; Cracker Barrel Old
Country Store, Inc.; DineEquity, Inc.; Domino’s Pizza, Inc.; Panera Bread Company; Ruby Tuesday, Inc.; Sonic Corp.; The Cheesecake Factory Inc.; and The Wendy’s
Company.
(2) The Old Peer Group Index comprises the following companies: Brinker International, Inc.; Chipotle Mexican Grill Inc.; Cracker Barrel Old Country Store, Inc.; Darden
Restaurants, Inc.; DineEquity, Inc.; Domino’s Pizza, Inc.; Panera Bread Company; Ruby Tuesday, Inc.; Sonic Corp.; The Cheesecake Factory Inc.; and The Wendy’s
Company.
19


