Jack In The Box 2014 Annual Report Download - page 5
Download and view the complete annual report
Please find page 5 of the 2014 Jack In The Box annual report below. You can navigate through the pages in the report by either clicking on the pages listed below, or by using the keyword search tool below to find specific information within the annual report.-
 1
1 -
 2
2 -
 3
3 -
 4
4 -
 5
5 -
 6
6 -
 7
7 -
 8
8 -
 9
9 -
 10
10 -
 11
11 -
 12
12 -
 13
13 -
 14
14 -
 15
15 -
 16
16 -
17
-
18
-
19
-
20
-
21
-
22
-
23
-
24
-
25
-
26
-
27
-
28
-
29
-
30
-
31
-
32
-
33
-
34
-
35
-
36
-
37
-
38
-
39
-
40
-
41
-
42
-
43
-
44
-
45
-
46
-
47
-
48
-
49
-
50
-
51
-
52
-
53
-
54
-
55
-
56
-
57
-
58
-
59
-
60
-
61
-
62
-
63
-
64
-
65
-
66
-
67
-
68
-
69
-
70
-
71
-
72
-
73
-
74
-
75
-
76
-
77
-
78
-
79
-
80
-
81
-
82
-
83
-
84
-
85
-
86
-
87
-
88
-
89
-
90
-
91
-
92
-
93
-
94
-
95
-
96
 |
 |

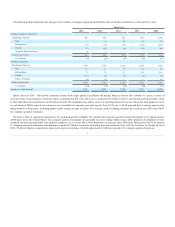
The following table summarizes the changes in the number of company-operated and franchise Jack in the Box restaurants over the past five years:
Company-operated restaurants:
Beginning of period
465
547
629
956
1,190
New
1
6
19
15
30
Refranchised
(37)
(78)
(97)
(332)
(219)
Closed
(2)
(11)
(4)
(10)
(46)
Acquired from franchisees
4
1
—
—
1
End of period total
431
465
547
629
956
% of system
19%
21%
24%
28%
43%
Franchise restaurants:
Beginning of period
1,786
1,703
1,592
1,250
1,022
New
11
11
18
16
16
Refranchised
37
78
97
332
219
Closed
(11)
(5)
(4)
(6)
(6)
Sold to Company
(4)
(1)
—
—
(1)
End of period total
1,819
1,786
1,703
1,592
1,250
% of system
81%
79%
76%
72%
57%
System end of period total
2,250
2,251
2,250
2,221
2,206
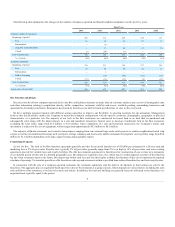
Qdoba Mexican Grill. Our Qdoba restaurants feature fresh, high quality ingredients and unique Mexican flavors that combine to create a variety of
innovative flavors and products. Customer orders are prepared in full view, which gives our guests the ability to build a customized meal specifically suited
to their individual taste preferences and nutritional needs. Our restaurants also offer a variety of catering options that can be tailored to feed groups of ten to
several hundred. While some of our restaurants serve breakfast, the majority generally operate from 10:30 a.m. to 10:00 p.m. and have a seating capacity that
ranges from 60 to 80 persons, including outdoor patio seating at many locations. The average check, excluding catering sales, in fiscal year 2014 was $10.93
for company-operated restaurants.
We believe there is significant opportunity for continued growth at Qdoba. We estimate the long-term growth potential for Qdoba to be approximately
2,000 units across the United States. Our company-operated restaurants are generally located in larger market areas, while franchise development is more
weighted towards non-traditional sites (airports, campuses, etc.) or areas where local franchisees can operate more efficiently. During fiscal 2014, we opened
16 company-operated restaurants and franchisees opened 22 Qdoba restaurants, including four non-traditional sites and two locations in Canada. In fiscal
2015, 50-60 new Qdoba restaurants are expected to open system-wide, of which approximately half are expected to be company-operated locations.
3