JP Morgan Chase 2013 Annual Report Download - page 7
Download and view the complete annual report
Please find page 7 of the 2013 JP Morgan Chase annual report below. You can navigate through the pages in the report by either clicking on the pages listed below, or by using the keyword search tool below to find specific information within the annual report.-
 1
1 -
 2
2 -
 3
3 -
 4
4 -
 5
5 -
 6
6 -
 7
7 -
 8
8 -
 9
9 -
 10
10 -
 11
11 -
 12
12 -
 13
13 -
 14
14 -
 15
15 -
 16
16 -
 17
17 -
 18
18 -
19
-
20
-
21
-
22
-
23
-
24
-
25
-
26
-
27
-
28
-
29
-
30
-
31
-
32
-
33
-
34
-
35
-
36
-
37
-
38
-
39
-
40
-
41
-
42
-
43
-
44
-
45
-
46
-
47
-
48
-
49
-
50
-
51
-
52
-
53
-
54
-
55
-
56
-
57
-
58
-
59
-
60
-
61
-
62
-
63
-
64
-
65
-
66
-
67
-
68
-
69
-
70
-
71
-
72
-
73
-
74
-
75
-
76
-
77
-
78
-
79
-
80
-
81
-
82
-
83
-
84
-
85
-
86
-
87
-
88
-
89
-
90
-
91
-
92
-
93
-
94
-
95
-
96
-
97
-
98
-
99
-
100
-
101
-
102
-
103
-
104
-
105
-
106
-
107
-
108
-
109
-
110
-
111
-
112
-
113
-
114
-
115
-
116
-
117
-
118
-
119
-
120
-
121
-
122
-
123
-
124
-
125
-
126
-
127
-
128
-
129
-
130
-
131
-
132
-
133
-
134
-
135
-
136
-
137
-
138
-
139
-
140
-
141
-
142
-
143
-
144
-
145
-
146
-
147
-
148
-
149
-
150
-
151
-
152
-
153
-
154
-
155
-
156
-
157
-
158
-
159
-
160
-
161
-
162
-
163
-
164
-
165
-
166
-
167
-
168
-
169
-
170
-
171
-
172
-
173
-
174
-
175
-
176
-
177
-
178
-
179
-
180
-
181
-
182
-
183
-
184
-
185
-
186
-
187
-
188
-
189
-
190
-
191
-
192
-
193
-
194
-
195
-
196
-
197
-
198
-
199
-
200
-
201
-
202
-
203
-
204
-
205
-
206
-
207
-
208
-
209
-
210
-
211
-
212
-
213
-
214
-
215
-
216
-
217
-
218
-
219
-
220
-
221
-
222
-
223
-
224
-
225
-
226
-
227
-
228
-
229
-
230
-
231
-
232
-
233
-
234
-
235
-
236
-
237
-
238
-
239
-
240
-
241
-
242
-
243
-
244
-
245
-
246
-
247
-
248
-
249
-
250
-
251
-
252
-
253
-
254
-
255
-
256
-
257
-
258
-
259
-
260
-
261
-
262
-
263
-
264
-
265
-
266
-
267
-
268
-
269
-
270
-
271
-
272
-
273
-
274
-
275
-
276
-
277
-
278
-
279
-
280
-
281
-
282
-
283
-
284
-
285
-
286
-
287
-
288
-
289
-
290
-
291
-
292
-
293
-
294
-
295
-
296
-
297
-
298
-
299
-
300
-
301
-
302
-
303
-
304
-
305
-
306
-
307
-
308
-
309
-
310
-
311
-
312
-
313
-
314
-
315
-
316
-
317
-
318
-
319
-
320
-
321
-
322
-
323
-
324
-
325
-
326
-
327
-
328
-
329
-
330
-
331
-
332
-
333
-
334
-
335
-
336
-
337
-
338
-
339
-
340
-
341
-
342
-
343
-
344
 |
 |

55
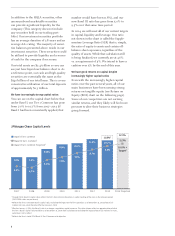
Corporate Clients 20% (9)% 20%
Small Business 52% 18% (8)%
Card & Auto 10% (10)% 12%
Commercial/ 18% 11% 8%
Middle Market
Asset 48% 41% 17%
Management
Mortgage/ (5)% 22% (7)%
Home Equity
Total Consumer & 13% 17% 5%
Commercial Banking
'10 to '11 '11 to '12
Year-over-Year Change
'12 to '13
2013201220112010 2013201220112010
$165
$67
$93
$83
$156
$100
$110
$91
$191
$141
$122
$82
$419
$474
$556
$20
$177
$165
$131
$92
$583
$18
$11
$17
$1.2
$1.4
$1.3
$1.5
Our clients also exhibit their faith in us by entrusting us to take care of their money
— either as deposits or as client assets entrusted to us — as shown in the chart below.
New and Renewed Credit and Capital for Clients
at December 31,
Assets Entrusted to Us by Our Clients
at December 31,
Corporate Clients
($ in trillions)
Consumer and Commercial Banking
($ in billions)
Deposits
Consumer 7% 10% 6%
Wholesale 31% 3% 9%
Client assets(a) 5% 10% 13%
'10 to '11 '11 to '12
Year-over-Year Change
'12 to '13
Deposits and Client Assets
($ in billions)
2013201220112010
$1,942
$558
$372
$2,035
$730
$398
$2,244
$755
$439
$2,534
$824
$464
$3,163
$3,438
$3,822
Assets under custody(b)
($ in billions)
$16,120 $16,870 $18,835 $20,485
$2,872
(a) Client assets include assets under management,
custody, brokerage, administration accounts and all
Chase Wealth Management assets not managed by
Asset Management
(b) Represents activities associated with the
safekeeping and servicing of assets