JP Morgan Chase 2013 Annual Report Download - page 11
Download and view the complete annual report
Please find page 11 of the 2013 JP Morgan Chase annual report below. You can navigate through the pages in the report by either clicking on the pages listed below, or by using the keyword search tool below to find specific information within the annual report.-
 1
1 -
 2
2 -
 3
3 -
 4
4 -
 5
5 -
 6
6 -
 7
7 -
 8
8 -
 9
9 -
 10
10 -
 11
11 -
 12
12 -
 13
13 -
 14
14 -
 15
15 -
 16
16 -
 17
17 -
 18
18 -
 19
19 -
 20
20 -
 21
21 -
 22
22 -
23
-
24
-
25
-
26
-
27
-
28
-
29
-
30
-
31
-
32
-
33
-
34
-
35
-
36
-
37
-
38
-
39
-
40
-
41
-
42
-
43
-
44
-
45
-
46
-
47
-
48
-
49
-
50
-
51
-
52
-
53
-
54
-
55
-
56
-
57
-
58
-
59
-
60
-
61
-
62
-
63
-
64
-
65
-
66
-
67
-
68
-
69
-
70
-
71
-
72
-
73
-
74
-
75
-
76
-
77
-
78
-
79
-
80
-
81
-
82
-
83
-
84
-
85
-
86
-
87
-
88
-
89
-
90
-
91
-
92
-
93
-
94
-
95
-
96
-
97
-
98
-
99
-
100
-
101
-
102
-
103
-
104
-
105
-
106
-
107
-
108
-
109
-
110
-
111
-
112
-
113
-
114
-
115
-
116
-
117
-
118
-
119
-
120
-
121
-
122
-
123
-
124
-
125
-
126
-
127
-
128
-
129
-
130
-
131
-
132
-
133
-
134
-
135
-
136
-
137
-
138
-
139
-
140
-
141
-
142
-
143
-
144
-
145
-
146
-
147
-
148
-
149
-
150
-
151
-
152
-
153
-
154
-
155
-
156
-
157
-
158
-
159
-
160
-
161
-
162
-
163
-
164
-
165
-
166
-
167
-
168
-
169
-
170
-
171
-
172
-
173
-
174
-
175
-
176
-
177
-
178
-
179
-
180
-
181
-
182
-
183
-
184
-
185
-
186
-
187
-
188
-
189
-
190
-
191
-
192
-
193
-
194
-
195
-
196
-
197
-
198
-
199
-
200
-
201
-
202
-
203
-
204
-
205
-
206
-
207
-
208
-
209
-
210
-
211
-
212
-
213
-
214
-
215
-
216
-
217
-
218
-
219
-
220
-
221
-
222
-
223
-
224
-
225
-
226
-
227
-
228
-
229
-
230
-
231
-
232
-
233
-
234
-
235
-
236
-
237
-
238
-
239
-
240
-
241
-
242
-
243
-
244
-
245
-
246
-
247
-
248
-
249
-
250
-
251
-
252
-
253
-
254
-
255
-
256
-
257
-
258
-
259
-
260
-
261
-
262
-
263
-
264
-
265
-
266
-
267
-
268
-
269
-
270
-
271
-
272
-
273
-
274
-
275
-
276
-
277
-
278
-
279
-
280
-
281
-
282
-
283
-
284
-
285
-
286
-
287
-
288
-
289
-
290
-
291
-
292
-
293
-
294
-
295
-
296
-
297
-
298
-
299
-
300
-
301
-
302
-
303
-
304
-
305
-
306
-
307
-
308
-
309
-
310
-
311
-
312
-
313
-
314
-
315
-
316
-
317
-
318
-
319
-
320
-
321
-
322
-
323
-
324
-
325
-
326
-
327
-
328
-
329
-
330
-
331
-
332
-
333
-
334
-
335
-
336
-
337
-
338
-
339
-
340
-
341
-
342
-
343
-
344
 |
 |

99
1 Calculated based on gross
domestic investment banking
revenue for syndicated leverage
finance, mergers and acquisitions
(M&A), equity underwriting and
bond underwriting
Later in this letter, I will discuss how we
think all the new rules will aect our returns.
Our scale and breadth create large cross-
sell opportunities and strong competitive
advantage
Each of our four major businesses oper-
ates at good economies of scale and gets
significant additional advantages from the
other businesses. We believe this is one of
the key reasons we have maintained good
financial performance.
Below are some pretty powerful examples:
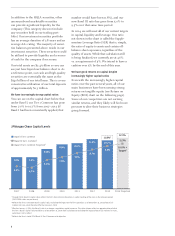
• Our North America Investment Bank
generates 29% of its investment banking
revenue1 through Commercial Bank clients
covered locally. This helps both our
Investment Bank and our Commercial
Bank do a better job serving their clients.
• Our Global Corporate Bank helped generate
$1.3 billion in revenue for our fixed income
sales and trading operation, increasing
business to our trading desks and helping
them oer better pricing to our clients.
• Our Private Bank gets new clients from both
our Investment Bank and our Commercial
Bank. And the Private Bank and Commer-
cial Bank would have a hard time existing
without our Chase retail branch network. In
fact, 55% of Commercial Bank clients and
35% of Private Bank households visit our
retail branches each quarter.
• Of our $1.6 trillion of assets under
management, approximately $300 billion
comes from the Corporate & Investment
Bank (CIB), the Commercial Bank or the
Consumer Bank.
• Fifty-ve percent of retail mortgages and
40% of Chase-branded credit cards are sold
through the retail branches.
In total, we believe that the combination of
our businesses accounts for $15 billion of
additional revenue, which helps drive both
profits and customer satisfaction. Each of our
businesses would be worse o but for the
other three.
Our capabilities are extraordinary and are dicult
to replicate — we can bring huge resources to bear
for the benefit of our company and our clients
Our scale creates huge cost eciencies and
enables significant resources to be brought
to bear for the benefit of our company. For
example, in global technology, we have
nearly 30,000 programmers, application
developers and information technology
employees who keep our 7,200 applications,
32 data centers, 58,000 servers, 300,000 desk-
tops and global network operating smoothly
for all our clients. Resources like these allow
us to constantly improve our operating
eciencies and bring enormous capability
to deal with issues when we need to do so
such as adjusting to all the new global rules
and requirements. In total, we believe that
expense synergies across the company save
us approximately $3 billion a year.
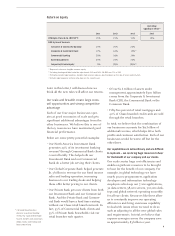
Return on Equity
Excluding
significant items(c)
2011 2012 2013 2013
JPMorgan Chase & Co. (ROTCE(a))15% 15% 11% 15%
ROE by line of business
Consumer & Community Banking 15% 25% 23%
Corporate & Investment Bank 17% 18% 15%(b)
Commercial Banking 30% 28% 19%
Asset Management 25% 24% 23%
Corporate/Private Equity 0% (3)% (9)%(d)
(a) Represents return on tangible common equity
(b) Excluding funding and debit valuation adjustments (FVA and DVA), CIB ROE was 17% in 2013
(c) Primarily excludes legal expenses, benefits from reserve releases, one-time gains on the sale of assets and FVA/DVA
(d) Includes legal expenses and one-time gains on the sale of assets