JP Morgan Chase 2013 Annual Report Download - page 12
Download and view the complete annual report
Please find page 12 of the 2013 JP Morgan Chase annual report below. You can navigate through the pages in the report by either clicking on the pages listed below, or by using the keyword search tool below to find specific information within the annual report.-
 1
1 -
 2
2 -
 3
3 -
 4
4 -
 5
5 -
 6
6 -
 7
7 -
 8
8 -
 9
9 -
 10
10 -
 11
11 -
 12
12 -
 13
13 -
 14
14 -
 15
15 -
 16
16 -
 17
17 -
 18
18 -
 19
19 -
 20
20 -
 21
21 -
 22
22 -
23
-
24
-
25
-
26
-
27
-
28
-
29
-
30
-
31
-
32
-
33
-
34
-
35
-
36
-
37
-
38
-
39
-
40
-
41
-
42
-
43
-
44
-
45
-
46
-
47
-
48
-
49
-
50
-
51
-
52
-
53
-
54
-
55
-
56
-
57
-
58
-
59
-
60
-
61
-
62
-
63
-
64
-
65
-
66
-
67
-
68
-
69
-
70
-
71
-
72
-
73
-
74
-
75
-
76
-
77
-
78
-
79
-
80
-
81
-
82
-
83
-
84
-
85
-
86
-
87
-
88
-
89
-
90
-
91
-
92
-
93
-
94
-
95
-
96
-
97
-
98
-
99
-
100
-
101
-
102
-
103
-
104
-
105
-
106
-
107
-
108
-
109
-
110
-
111
-
112
-
113
-
114
-
115
-
116
-
117
-
118
-
119
-
120
-
121
-
122
-
123
-
124
-
125
-
126
-
127
-
128
-
129
-
130
-
131
-
132
-
133
-
134
-
135
-
136
-
137
-
138
-
139
-
140
-
141
-
142
-
143
-
144
-
145
-
146
-
147
-
148
-
149
-
150
-
151
-
152
-
153
-
154
-
155
-
156
-
157
-
158
-
159
-
160
-
161
-
162
-
163
-
164
-
165
-
166
-
167
-
168
-
169
-
170
-
171
-
172
-
173
-
174
-
175
-
176
-
177
-
178
-
179
-
180
-
181
-
182
-
183
-
184
-
185
-
186
-
187
-
188
-
189
-
190
-
191
-
192
-
193
-
194
-
195
-
196
-
197
-
198
-
199
-
200
-
201
-
202
-
203
-
204
-
205
-
206
-
207
-
208
-
209
-
210
-
211
-
212
-
213
-
214
-
215
-
216
-
217
-
218
-
219
-
220
-
221
-
222
-
223
-
224
-
225
-
226
-
227
-
228
-
229
-
230
-
231
-
232
-
233
-
234
-
235
-
236
-
237
-
238
-
239
-
240
-
241
-
242
-
243
-
244
-
245
-
246
-
247
-
248
-
249
-
250
-
251
-
252
-
253
-
254
-
255
-
256
-
257
-
258
-
259
-
260
-
261
-
262
-
263
-
264
-
265
-
266
-
267
-
268
-
269
-
270
-
271
-
272
-
273
-
274
-
275
-
276
-
277
-
278
-
279
-
280
-
281
-
282
-
283
-
284
-
285
-
286
-
287
-
288
-
289
-
290
-
291
-
292
-
293
-
294
-
295
-
296
-
297
-
298
-
299
-
300
-
301
-
302
-
303
-
304
-
305
-
306
-
307
-
308
-
309
-
310
-
311
-
312
-
313
-
314
-
315
-
316
-
317
-
318
-
319
-
320
-
321
-
322
-
323
-
324
-
325
-
326
-
327
-
328
-
329
-
330
-
331
-
332
-
333
-
334
-
335
-
336
-
337
-
338
-
339
-
340
-
341
-
342
-
343
-
344
 |
 |

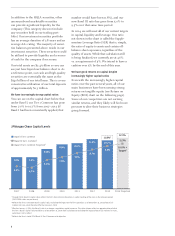
1010
Across the firm, we serve approximately
50% of U.S. households, approximately 80%
of Fortune 500 companies, and 60% of the
world’s largest pensions, sovereigns and
central banks. Today, our firm has on-the-
ground operations in 60 countries and serves
clients in more than 100 countries around
the world. To support those clients, we move
up to $10 trillion a day and lend or raise
capital of over $500 billion each quarter.
The markets in which we operate cover 5.6
billion people who speak 100+ languages
and use close to 50 currencies. It would be
dicult to replicate the size, capabilities and
knowledgeable sta of our businesses glob-
ally. We can help our clients when and where
they need it.
It is important to remember our capabili-
ties and eciencies accrue to our clients –
over time, they get the benefit in improved
pricing or better services.
This has led to increasing market share
and customer satisfaction in all of our main
businesses
None of the things previously mentioned
would matter if they didn’t help us do a
better job for our customers. You know your
business model is working when customers
– voting with their feet – give you more busi-
ness. Increasing market share and customer
satisfaction may not always immediately
show on the bottom line – but both are crit-
ical to the future growth of our businesses
and drive current and potential earnings
power of the company. The bullet points that
follow say it strongly.
Consumer & Community Banking
• Total deposits of $453 billion up 10% from
the prior year – more than two times the
industry average.
• #1 credit card issuer in the U.S. based on
loans outstanding. Record credit card sales
volume of $420 billion was up 10% from
the prior year – outpacing the industry in
sales growth for 23 consecutive quarters.
• #1 in customer satisfaction among the
largest banks for the second year in a
row, as ranked by the American Customer
Satisfaction Index (and, in the future, we
want to be #1 among all banks).
• Customer attrition at an all-time low.
• #1 in customer satisfaction in small busi-
ness banking in three of four regions of the
U.S. by J.D. Power and Associates and #1
Small Business Administration lender for
the fourth year in a row.
• #1 online nancial services destina-
tion (chase.com) (per compete.com as of
December 2013).
• #1 mobile banking functionality (Forrester
Research’s 2013 Global and U.S. Mobile
Banking Functionality Rankings).
• #1 ATM network; #2 retail branch
network.
Corporate & Investment Bank
• #1 in Global Investment Banking Fees.
• #1 Fixed Income Market revenue share of
top 10 investment banks; #1 Total Markets
revenue share of top 10 investment banks.
• #1 in Global Long-Term Debt.
• #1 in Global Loan Syndications.
• #1 in U.S. Announced M&A.
• #2 in Global Equity and Equity-Related;
#2 in Global Announced M&A.
• #6 in Cash Equities (we’re working on
that one).