JP Morgan Chase 2013 Annual Report Download - page 10
Download and view the complete annual report
Please find page 10 of the 2013 JP Morgan Chase annual report below. You can navigate through the pages in the report by either clicking on the pages listed below, or by using the keyword search tool below to find specific information within the annual report.-
 1
1 -
 2
2 -
 3
3 -
 4
4 -
 5
5 -
 6
6 -
 7
7 -
 8
8 -
 9
9 -
 10
10 -
 11
11 -
 12
12 -
 13
13 -
 14
14 -
 15
15 -
 16
16 -
 17
17 -
 18
18 -
 19
19 -
 20
20 -
 21
21 -
22
-
23
-
24
-
25
-
26
-
27
-
28
-
29
-
30
-
31
-
32
-
33
-
34
-
35
-
36
-
37
-
38
-
39
-
40
-
41
-
42
-
43
-
44
-
45
-
46
-
47
-
48
-
49
-
50
-
51
-
52
-
53
-
54
-
55
-
56
-
57
-
58
-
59
-
60
-
61
-
62
-
63
-
64
-
65
-
66
-
67
-
68
-
69
-
70
-
71
-
72
-
73
-
74
-
75
-
76
-
77
-
78
-
79
-
80
-
81
-
82
-
83
-
84
-
85
-
86
-
87
-
88
-
89
-
90
-
91
-
92
-
93
-
94
-
95
-
96
-
97
-
98
-
99
-
100
-
101
-
102
-
103
-
104
-
105
-
106
-
107
-
108
-
109
-
110
-
111
-
112
-
113
-
114
-
115
-
116
-
117
-
118
-
119
-
120
-
121
-
122
-
123
-
124
-
125
-
126
-
127
-
128
-
129
-
130
-
131
-
132
-
133
-
134
-
135
-
136
-
137
-
138
-
139
-
140
-
141
-
142
-
143
-
144
-
145
-
146
-
147
-
148
-
149
-
150
-
151
-
152
-
153
-
154
-
155
-
156
-
157
-
158
-
159
-
160
-
161
-
162
-
163
-
164
-
165
-
166
-
167
-
168
-
169
-
170
-
171
-
172
-
173
-
174
-
175
-
176
-
177
-
178
-
179
-
180
-
181
-
182
-
183
-
184
-
185
-
186
-
187
-
188
-
189
-
190
-
191
-
192
-
193
-
194
-
195
-
196
-
197
-
198
-
199
-
200
-
201
-
202
-
203
-
204
-
205
-
206
-
207
-
208
-
209
-
210
-
211
-
212
-
213
-
214
-
215
-
216
-
217
-
218
-
219
-
220
-
221
-
222
-
223
-
224
-
225
-
226
-
227
-
228
-
229
-
230
-
231
-
232
-
233
-
234
-
235
-
236
-
237
-
238
-
239
-
240
-
241
-
242
-
243
-
244
-
245
-
246
-
247
-
248
-
249
-
250
-
251
-
252
-
253
-
254
-
255
-
256
-
257
-
258
-
259
-
260
-
261
-
262
-
263
-
264
-
265
-
266
-
267
-
268
-
269
-
270
-
271
-
272
-
273
-
274
-
275
-
276
-
277
-
278
-
279
-
280
-
281
-
282
-
283
-
284
-
285
-
286
-
287
-
288
-
289
-
290
-
291
-
292
-
293
-
294
-
295
-
296
-
297
-
298
-
299
-
300
-
301
-
302
-
303
-
304
-
305
-
306
-
307
-
308
-
309
-
310
-
311
-
312
-
313
-
314
-
315
-
316
-
317
-
318
-
319
-
320
-
321
-
322
-
323
-
324
-
325
-
326
-
327
-
328
-
329
-
330
-
331
-
332
-
333
-
334
-
335
-
336
-
337
-
338
-
339
-
340
-
341
-
342
-
343
-
344
 |
 |

88
In addition to the HQLA securities, other
unencumbered marketable securities
can provide significant liquidity for the
company. (This category does not include
any securities held in our trading port-
folio.) Our investment securities portfolio
has an average duration of 2.8 years and an
average AA+ rating. The majority of securi-
ties balances presented above reside in our
investment securities. These securities could
be utilized to provide liquidity and a source
of cash for the company if necessary.
Our total assets are $2.4 trillion so you can
see just how liquid our balance sheet is. As
a reference point, our cash and high-quality
securities are essentially the same as the
$740 billion of our total loans. This is a very
conservative utilization of our total deposits
of approximately $1.3 trillion.
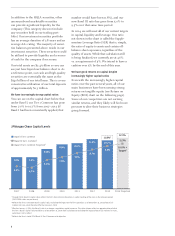
We have increasingly strong capital ratios
You can see on the capital chart below that
under Basel I, our Tier 1 Common has gone
from 7.0% to 10.7% from 2007–2013 (if
Basel I had been consistently applied, that
number would have been 11.8%), and our
new Basel III ratio has gone from 5.0% to
9.5% over that same time period.
In 2014, we will meet all of our current targets
in capital, liquidity and leverage. One ratio
not shown in the chart is called the Supple-
mentary Leverage Ratio (SLR) that is, simply,
the ratio of equity to assets and certain o-
balance sheet exposures, regardless of the
quality of assets. While that calculation still
is being finalized, we currently are at 4.6%
vs. a requirement of 5%. We intend to have a
cushion over 5% by the end of this year.
We have good returns on capital despite
increasingly higher capital ratios
Even with the increasingly higher capital
ratios over the past several years, all of our
main businesses have been earning strong
returns on tangible equity (see Return on
Equity (ROE) chart on the following page).
Some of our competitors are not earning
similar returns, and they likely will feel more
pressure to alter their business strategies
going forward.
JPMorgan Chase Capital Levels
2014 Projection2013201220112010200920082007
Basel I Tier 1 Common
Basel III Tier 1 Common1
Basel I Tier 1 Common Projection3
7.0% 7.0%
9.8% 10.1%
11.0%
9.5% 10.0% +
Target4
8.7%
11.8%2
12.3%
7.9%
7.0%
6.4%
4.7%
5.0%
10.7% 11.3%
8.8%
1 Through 2013, Basel III capital ratios reflect the firm’s best estimate based on its understanding of the rules in the relevant period
(2007-2008 ratios are pro forma)
2 Reflects the firm’s estimated Basel I capital ratio, excluding the impact on the firm’s positions as of December 31, 2013 of Basel 2.5
market-risk rules, which became eective January 1, 2013
3 Eective January 1, 2014, the Basel I ratio is no longer a regulatory capital measure. The ratios shown reflect an approximation of what
the firm’s Basel I capital ratio would be as of December 31, 2014, both including and excluding the impact of Basel 2.5 market-risk rules,
were Basel I still in eect
4 Reflects the firm’s stated 2014 Basel III Tier 1 Common ratio objective