JP Morgan Chase 2013 Annual Report Download - page 6
Download and view the complete annual report
Please find page 6 of the 2013 JP Morgan Chase annual report below. You can navigate through the pages in the report by either clicking on the pages listed below, or by using the keyword search tool below to find specific information within the annual report.-
 1
1 -
 2
2 -
 3
3 -
 4
4 -
 5
5 -
 6
6 -
 7
7 -
 8
8 -
 9
9 -
 10
10 -
 11
11 -
 12
12 -
 13
13 -
 14
14 -
 15
15 -
 16
16 -
 17
17 -
18
-
19
-
20
-
21
-
22
-
23
-
24
-
25
-
26
-
27
-
28
-
29
-
30
-
31
-
32
-
33
-
34
-
35
-
36
-
37
-
38
-
39
-
40
-
41
-
42
-
43
-
44
-
45
-
46
-
47
-
48
-
49
-
50
-
51
-
52
-
53
-
54
-
55
-
56
-
57
-
58
-
59
-
60
-
61
-
62
-
63
-
64
-
65
-
66
-
67
-
68
-
69
-
70
-
71
-
72
-
73
-
74
-
75
-
76
-
77
-
78
-
79
-
80
-
81
-
82
-
83
-
84
-
85
-
86
-
87
-
88
-
89
-
90
-
91
-
92
-
93
-
94
-
95
-
96
-
97
-
98
-
99
-
100
-
101
-
102
-
103
-
104
-
105
-
106
-
107
-
108
-
109
-
110
-
111
-
112
-
113
-
114
-
115
-
116
-
117
-
118
-
119
-
120
-
121
-
122
-
123
-
124
-
125
-
126
-
127
-
128
-
129
-
130
-
131
-
132
-
133
-
134
-
135
-
136
-
137
-
138
-
139
-
140
-
141
-
142
-
143
-
144
-
145
-
146
-
147
-
148
-
149
-
150
-
151
-
152
-
153
-
154
-
155
-
156
-
157
-
158
-
159
-
160
-
161
-
162
-
163
-
164
-
165
-
166
-
167
-
168
-
169
-
170
-
171
-
172
-
173
-
174
-
175
-
176
-
177
-
178
-
179
-
180
-
181
-
182
-
183
-
184
-
185
-
186
-
187
-
188
-
189
-
190
-
191
-
192
-
193
-
194
-
195
-
196
-
197
-
198
-
199
-
200
-
201
-
202
-
203
-
204
-
205
-
206
-
207
-
208
-
209
-
210
-
211
-
212
-
213
-
214
-
215
-
216
-
217
-
218
-
219
-
220
-
221
-
222
-
223
-
224
-
225
-
226
-
227
-
228
-
229
-
230
-
231
-
232
-
233
-
234
-
235
-
236
-
237
-
238
-
239
-
240
-
241
-
242
-
243
-
244
-
245
-
246
-
247
-
248
-
249
-
250
-
251
-
252
-
253
-
254
-
255
-
256
-
257
-
258
-
259
-
260
-
261
-
262
-
263
-
264
-
265
-
266
-
267
-
268
-
269
-
270
-
271
-
272
-
273
-
274
-
275
-
276
-
277
-
278
-
279
-
280
-
281
-
282
-
283
-
284
-
285
-
286
-
287
-
288
-
289
-
290
-
291
-
292
-
293
-
294
-
295
-
296
-
297
-
298
-
299
-
300
-
301
-
302
-
303
-
304
-
305
-
306
-
307
-
308
-
309
-
310
-
311
-
312
-
313
-
314
-
315
-
316
-
317
-
318
-
319
-
320
-
321
-
322
-
323
-
324
-
325
-
326
-
327
-
328
-
329
-
330
-
331
-
332
-
333
-
334
-
335
-
336
-
337
-
338
-
339
-
340
-
341
-
342
-
343
-
344
 |
 |

44
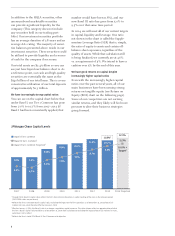
Here’s what most of the headlines left out: JPMorgan Chase continued to serve our
clients and make a significant positive impact on our communities. In 2013, the firm
provided credit and raised capital of more than $2.1 trillion for our clients. The
firm also has hired more than 6,300 military veterans since 2011 as a proud founding
member of the 100,000 Jobs Mission, which now has increased the goal to 200,000
jobs. Our firm was there to help small businesses — we provided $19 billion of credit
to U.S. small businesses, which allowed them to develop new products, expand their
operations and hire more workers. We also were there for families to buy their first
home with a mortgage we made possible — overall, we originated more than 800,000
mortgages last year. In total, we provided $274 billion of credit to consumers. Our
strength allows us to be there for our clients and communities in good times — and,
more important, in bad times. In this, we have never faltered.
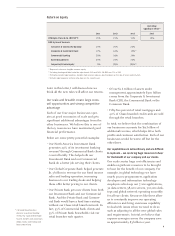
Stock and Book Value Performance
Stock Total Return Analysis
Bank One S&P 500 S&P Financials Index
Performance since becoming CEO of Bank One
(3/26/2000–12/31/2013)(a):
Compounded Annual Gain 10.4% 3.3% 1.3%
Overall Gain 289.8% 57.3% 19.3%
JPMorgan Chase & Co. S&P 500 S&P Financials Index
Performance since the Bank One
and JPMorgan Chase & Co. merger
(7/1/2004–12/31/2013):
Compounded Annual Gain (Loss) 7.2% 7.4% (0.5)%
Overall Gain (Loss) 94.1% 97.5% (5.0)%
These charts show actual returns of the stock, with dividends included, for heritage shareholders of Bank One and JPMorgan Chase & Co.
vs. the Standard & Poor’s 500 Index (S&P 500) and the Standard & Poor’s Financials Index (S&P Financials Index).
(a) On March 27, 2000, Jamie Dimon was hired as CEO of Bank One
Bank One/JPMorgan Chase & Co. Tangible Book Value per Share Performance vs. S&P 500
Bank One
(A)
S&P 500
(B)
Relative Results
(A) — (B)
Performance since becoming CEO of Bank One
(3/26/2000–12/31/2013)(a):
Compounded Annual Gain 12.9% 4.6% 8.3%
Overall Gain 385.7% 80.4% 305.3%
JPMorgan Chase & Co.
(A)
S&P 500
(B)
Relative Results
(A) — (B)
Performance since the Bank One
and JPMorgan Chase & Co. merger
(7/1/2004–12/31/2013):
Compounded Annual Gain 14.5% 7.4% 7.1%
Overall Gain 261.9% 97.5% 164.4%
Tangible book value over time captures the company’s use of capital, balance sheet and profitability. In this chart, we are looking at
heritage Bank One shareholders and JPMorgan Chase & Co. shareholders. The chart shows the increase in tangible book value per share;
it is an after-tax number assuming all dividends were retained vs. the S&P 500 (a pre-tax number with dividends reinvested).
(a) On March 27, 2000, Jamie Dimon was hired as CEO of Bank One