Intel 2003 Annual Report Download - page 76
Download and view the complete annual report
Please find page 76 of the 2003 Intel annual report below. You can navigate through the pages in the report by either clicking on the pages listed below, or by using the keyword search tool below to find specific information within the annual report.-
 1
1 -
2
-
3
-
4
-
5
-
6
-
7
-
8
-
9
-
10
-
11
-
12
-
13
-
14
-
15
-
16
-
17
-
18
-
19
-
20
-
21
-
22
-
23
-
24
-
25
-
26
-
27
-
28
-
29
-
30
-
31
-
32
-
33
-
34
-
35
-
36
-
37
-
38
-
39
-
40
-
41
-
42
-
43
-
44
-
45
-
46
-
47
-
48
-
49
-
50
-
51
-
52
-
53
-
54
-
55
-
56
-
57
-
58
-
59
-
60
-
61
-
62
-
63
-
64
-
65
-
 66
66 -
 67
67 -
 68
68 -
 69
69 -
 70
70 -
 71
71 -
 72
72 -
 73
73 -
 74
74 -
 75
75 -
 76
76 -
 77
77 -
 78
78 -
 79
79 -
 80
80 -
 81
81 -
 82
82 -
 83
83 -
 84
84 -
 85
85 -
 86
86 -
87
-
88
-
89
-
90
-
91
-
92
-
93
-
94
-
95
-
96
-
97
-
98
-
99
-
100
-
101
-
102
-
103
-
104
-
105
-
106
-
107
-
108
-
109
-
110
-
111
-
112
-
113
-
114
-
115
-
116
-
117
-
118
-
119
-
120
-
121
-
122
-
123
-
124
-
125
 |
 |

Table of Contents
Index to Financial Statements
INTEL CORPORATION
NOTES TO CONSOLIDATED FINANCIAL STATEMENTS (Continued)
During 2001, the company granted merit-based options that would typically have been granted in 2002, in order to enhance the potential
long-term retention value of these stock options. This grant is referred to in the table above as “2002 merit grant.”
The 2002 merit grant vests in
2007, on about the same date that the options would vest if they had been granted in 2002. Merit grants made in 2002, included in “other
grants” in the table above, were reduced by the shares granted in this early grant program during 2001.
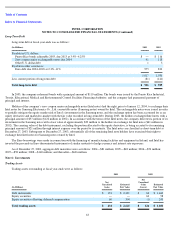
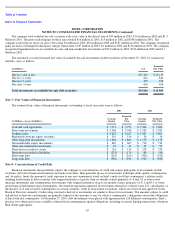
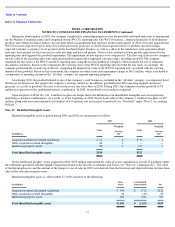
The range of option exercise prices for options outstanding at December 27, 2003 was $0.01 to $87.90. This range reflects the impact of
options assumed with acquired companies in addition to the fluctuating price of Intel common stock.
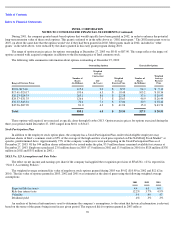
The following table summarizes information about options outstanding at December 27, 2003:
These options will expire if not exercised at specific dates through October 2013. Option exercise prices for options exercised during the
three-year period ended December 27, 2003 ranged from $0.01 to $36.47.
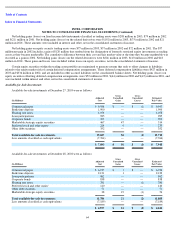
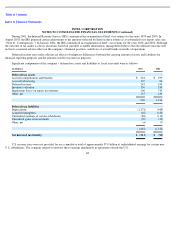
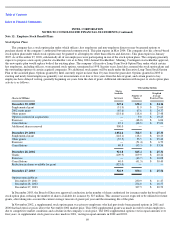
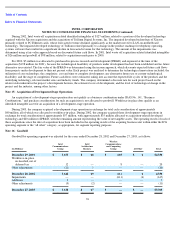
Stock Participation Plan
In addition to the employee stock option plans, the company has a Stock Participation Plan, under which eligible employees may
purchase shares of Intel’s common stock at 85% of the average of the high and low stock price reported on The NASDAQ Stock Market* at
specific, predetermined dates. Approximately 75% of the company’s employees were participating in the Stock Participation Plan as of
December 27, 2003. Of the 944 million shares authorized to be issued under the plan, 85.9 million shares remained available for issuance at
December 27, 2003. Employees purchased 23.8 million shares in 2003 (17.0 million in 2002 and 13.0 million in 2001) for $328 million ($338
million in 2002 and $351 million in 2001).
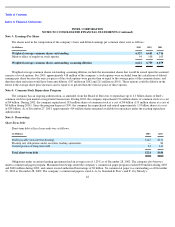
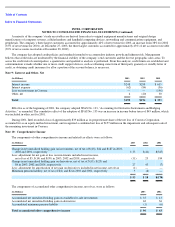
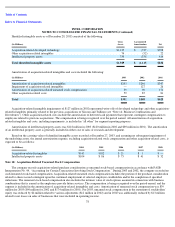
SFAS No. 123 Assumptions and Fair Value
The effect on net income and earnings per share if the company had applied the recognition provision of SFAS No. 123 is reported in
“Note 2: Accounting Policies.”
The weighted average estimated fair value of employee stock options granted during 2003 was $9.02 ($10.89 in 2002 and $12.62 in
2001). The fair value of options granted in 2003, 2002 and 2001 was estimated at the date of grant using the following weighted average
assumptions:
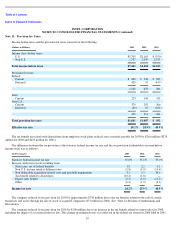
An analysis of historical information is used to determine the company’
s assumptions, to the extent that historical information is relevant,
based on the terms of the grants being issued in any given period. The expected life for options granted in 2003 reflects
70
Outstanding Options
Exercisable Options
Range of Exercise Prices
Number of
Shares
(In Millions)
Weighted
Average
Contractual
Life
(In Years)
Weighted
Average
Exercise Price
Number of
Shares
(In Millions)
Weighted
Average
Exercise
Price
$0.01
–
$
17.40
115.4
3.0
$
8.57
94.3
$
7.13
$17.41
–
$
20.17
193.6
6.3
$
18.48
103.2
$
18.34
$20.23
–
$
24.35
263.1
8.0
$
22.38
37.6
$
20.97
$24.37
–
$
31.35
126.6
7.1
$
28.63
46.9
$
26.44
$31.37
–
$
45.16
70.4
7.1
$
37.06
30.5
$
38.46
$45.96
–
$
87.90
81.0
6.3
$
61.96
15.0
$
63.74
Total
850.1
6.5
$
25.54
327.5
$
20.53
2003
2002
2001
Expected life (in years)
4.4
6.0
6.0
Risk
-
free interest rate
12.2
%
3.7
%
4.9
%
Volatility
.5
4
.4
9
.4
7
Dividend yield
.4
%
.3
%
.3
%