Intel 2003 Annual Report Download - page 44
Download and view the complete annual report
Please find page 44 of the 2003 Intel annual report below. You can navigate through the pages in the report by either clicking on the pages listed below, or by using the keyword search tool below to find specific information within the annual report.-
 1
1 -
2
-
3
-
4
-
5
-
6
-
7
-
8
-
9
-
10
-
11
-
12
-
13
-
14
-
15
-
16
-
17
-
18
-
19
-
20
-
21
-
22
-
23
-
24
-
25
-
26
-
27
-
28
-
29
-
30
-
31
-
32
-
33
-
 34
34 -
 35
35 -
 36
36 -
 37
37 -
 38
38 -
 39
39 -
 40
40 -
 41
41 -
 42
42 -
 43
43 -
 44
44 -
 45
45 -
 46
46 -
 47
47 -
 48
48 -
 49
49 -
 50
50 -
 51
51 -
 52
52 -
 53
53 -
 54
54 -
55
-
56
-
57
-
58
-
59
-
60
-
61
-
62
-
63
-
64
-
65
-
66
-
67
-
68
-
69
-
70
-
71
-
72
-
73
-
74
-
75
-
76
-
77
-
78
-
79
-
80
-
81
-
82
-
83
-
84
-
85
-
86
-
87
-
88
-
89
-
90
-
91
-
92
-
93
-
94
-
95
-
96
-
97
-
98
-
99
-
100
-
101
-
102
-
103
-
104
-
105
-
106
-
107
-
108
-
109
-
110
-
111
-
112
-
113
-
114
-
115
-
116
-
117
-
118
-
119
-
120
-
121
-
122
-
123
-
124
-
125
 |
 |

Table of Contents
Index to Financial Statements
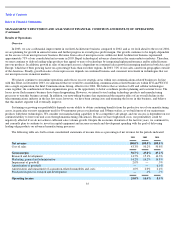
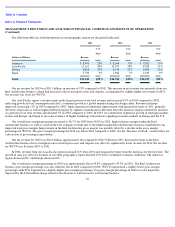
MANAGEMENT’S DISCUSSION AND ANALYSIS OF FINANCIAL CONDITION AND RESULTS OF OPERATIONS
(Continued)
Financial Condition
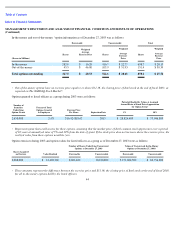
Our financial condition remains strong. At December 27, 2003, cash, short-term investments and fixed income instruments included in
trading assets totaled $15.9 billion, up from $12.2 billion at December 28, 2002. At December 27, 2003, total short-term and long-term debt
was $1.2 billion and represented 3% of stockholders’ equity. At December 28, 2002, total debt was $1.4 billion and represented 4% of
stockholders’ equity.
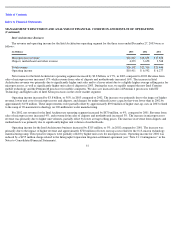
For 2003, cash provided by operating activities was $11.5 billion, compared to $9.1 billion in 2002 and $8.8 billion in 2001. Cash was
provided by net income adjusted for non-cash-related items. Working capital uses of cash included increases in accounts receivable and
inventories, and a decrease in income taxes payable. Accounts receivable increased over December 2002 levels, primarily due to higher
revenue. The days’ sales outstanding also increased to 36 days from 34 days at December 2002. For 2003, our three largest customers
accounted for approximately 42% of net revenue, with one of these customers accounting for approximately 19% of revenue and another
customer accounting for approximately 15%. For 2002, our three largest customers accounted for approximately 38% of net revenue (35% of
net revenue for 2001). Additionally, these three largest customers accounted for approximately 43% of net accounts receivable at December 27,
2003 (approximately 39% at December 28, 2002 and December 29, 2001). Overall inventory levels were higher by 11% at the end of 2003
compared to 2002 as we ramped new products for sale in 2004. The decrease in the accrual for income taxes payable was primarily due to the
impact of tax benefits related to divestitures in the fourth quarter of 2003. Working capital sources of cash included an increase in accrued
compensation and benefits, largely due to higher accruals for employee bonuses related to our higher level of profitability in 2003.
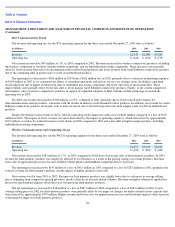
We used $7.1 billion in net cash for investing activities during 2003, compared to $5.8 billion during 2002 and $330 million during 2001.
The increase in cash generated from operations compared to 2002 resulted in net purchases of available-for-
sale investments in 2003. Improved
corporate credit profiles facilitated a slight shift in our portfolio of investments in debt securities to longer term maturities. Additionally, during
2003 we used $450 million in cash to acquire stock rights exchangeable into approximately 33.9 million shares of Micron Technology, Inc.
Capital expenditures decreased to $3.7 billion in 2003 as we continued to invest in capital equipment and construction, primarily for additional
microprocessor manufacturing capacity, but at a lower rate than in the prior two years. Capital expenditures were $4.7 billion in 2002 and $7.3
billion in 2001. The increase in cash used for investing activities in 2002 compared to 2001 reflected the relatively large net sales and
maturities of available-for-sale investments that occurred in 2001.
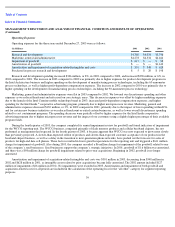
We used $3.9 billion in net cash for financing activities in 2003, relatively flat compared to the prior year, which had been up slightly
compared to 2001. The major financing use of cash in all three years was for the repurchase of shares. In 2003, we purchased 176 million
shares of common stock for $4 billion ($4 billion in 2002 and 2001). At December 27, 2003, approximately 414 million shares remained
available for repurchase under the existing repurchase authorization. Another major financing use of cash in all three years was for the payment
of dividends. Payment of dividends was $524 million in 2003 ($533 million in 2002 and $538 million in 2001). In January 2004, our Board of
Directors approved an increase in the quarterly cash dividend from $0.02 per share to $0.04 per share, effective for the first-quarter 2004
dividend. Financing sources of cash during 2003 were primarily $967 million in proceeds from the sale of shares pursuant to employee stock
benefit plans ($681 million in 2002 and $762 million in 2001).
Another potential source of liquidity is authorized borrowings, including commercial paper, of $3 billion. Maximum borrowings under
our commercial paper program during 2003 were approximately $30 million, although no commercial paper was outstanding at the end of the
period. We also maintain the ability to issue an aggregate of approximately $1.4 billion in debt, equity and other securities under U.S.
Securities and Exchange Commission shelf registration statements.
We believe that we have the financial resources needed to meet business requirements for the next 12 months, including capital
expenditures for the expansion or upgrading of worldwide manufacturing and assembly and test capacity, working capital requirements, the
dividend program, potential stock repurchases and potential future acquisitions or strategic investments.
41