ING Direct 2011 Annual Report Download - page 15
Download and view the complete annual report
Please find page 15 of the 2011 ING Direct annual report below. You can navigate through the pages in the report by either clicking on the pages listed below, or by using the keyword search tool below to find specific information within the annual report.-
 1
1 -
2
-
3
-
4
-
 5
5 -
 6
6 -
 7
7 -
 8
8 -
 9
9 -
 10
10 -
 11
11 -
 12
12 -
 13
13 -
 14
14 -
 15
15 -
 16
16 -
 17
17 -
 18
18 -
 19
19 -
 20
20 -
 21
21 -
 22
22 -
 23
23 -
 24
24 -
 25
25 -
26
-
27
-
28
-
29
-
30
-
31
-
32
-
33
-
34
-
35
-
36
-
37
-
38
-
39
-
40
-
41
-
42
-
43
-
44
-
45
-
46
-
47
-
48
-
49
-
50
-
51
-
52
-
53
-
54
-
55
-
56
-
57
-
58
-
59
-
60
-
61
-
62
-
63
-
64
-
65
-
66
-
67
-
68
-
69
-
70
-
71
-
72
-
73
-
74
-
75
-
76
-
77
-
78
-
79
-
80
-
81
-
82
-
83
-
84
-
85
-
86
-
87
-
88
-
89
-
90
-
91
-
92
-
93
-
94
-
95
-
96
-
97
-
98
-
99
-
100
-
101
-
102
-
103
-
104
-
105
-
106
-
107
-
108
-
109
-
110
-
111
-
112
-
113
-
114
-
115
-
116
-
117
-
118
-
119
-
120
-
121
-
122
-
123
-
124
-
125
-
126
-
127
-
128
-
129
-
130
-
131
-
132
-
133
-
134
-
135
-
136
-
137
-
138
-
139
-
140
-
141
-
142
-
143
-
144
-
145
-
146
-
147
-
148
-
149
-
150
-
151
-
152
-
153
-
154
-
155
-
156
-
157
-
158
-
159
-
160
-
161
-
162
-
163
-
164
-
165
-
166
-
167
-
168
-
169
-
170
-
171
-
172
-
173
-
174
-
175
-
176
-
177
-
178
-
179
-
180
-
181
-
182
-
183
-
184
-
185
-
186
-
187
-
188
-
189
-
190
-
191
-
192
-
193
-
194
-
195
-
196
-
197
-
198
-
199
-
200
-
201
-
202
-
203
-
204
-
205
-
206
-
207
-
208
-
209
-
210
-
211
-
212
-
213
-
214
-
215
-
216
-
217
-
218
-
219
-
220
-
221
-
222
-
223
-
224
-
225
-
226
-
227
-
228
-
229
-
230
-
231
-
232
-
233
-
234
-
235
-
236
-
237
-
238
-
239
-
240
-
241
-
242
-
243
-
244
-
245
-
246
-
247
-
248
-
249
-
250
-
251
-
252
-
253
-
254
-
255
-
256
-
257
-
258
-
259
-
260
-
261
-
262
-
263
-
264
-
265
-
266
-
267
-
268
-
269
-
270
-
271
-
272
-
273
-
274
-
275
-
276
-
277
-
278
-
279
-
280
-
281
-
282
-
283
-
284
-
285
-
286
-
287
-
288
-
289
-
290
-
291
-
292
-
293
-
294
-
295
-
296
-
297
-
298
-
299
-
300
-
301
-
302
-
303
-
304
-
305
-
306
-
307
-
308
-
309
-
310
-
311
-
312
-
313
-
314
-
315
-
316
-
317
-
318
-
319
-
320
-
321
-
322
-
323
-
324
-
325
-
326
-
327
-
328
-
329
-
330
-
331
-
332
 |
 |

1 Who we are 2 Report of the Executive Board 3 Corporate governance 4 Consolidated annual accounts 5 Parent company annual accounts 6 Other information 7 Additional information
ECONOMIES IN EUROPE AND BEYOND SUFFERED
ANEGATIVE TURNAROUND
As a result of the European debt crisis, macroeconomic conditions
started to deteriorate in the second half of 2011. Eurozone
consumer and producer confidence declined sharply, international
trade stopped growing, companies’ willingness to invest fell and
employment perspectives started to deteriorate markedly.
Whilst Europe seemed to be sliding into recession in 2011, the US
economy showed signs of resilience in the second half of the year.
Jobs data and unemployment rates gave grounds for market
confidence and even some of the housing data was less negative
than anticipated. However, the rate of growth of the US economy
was still low in 2011.
By contrast, in many emerging economies like China, India and Brazil,
household spending and corporate investment stayed at elevated
levels and thus fuelled job creation, but this was not enough to quell
fears of a further widening of global imbalances. Major imbalances
between Asia and the Western world and between North and South
in Europe continue to exist and threaten economic growth, and the
stability of the global financial system. Looking ahead, underlying
sovereign and financial system vulnerabilities remain a significant
concern. The outlook for a large part of the global economy in 2012
therefore seems to be somewhat gloomy.
The uncertain economic outlook, the turbulence on financial
markets, and the fact that market values for activities to be
divested are very low, have had implications for ING’s strategy.
On 12 January 2012, we announced that the base case of two IPOs
is replaced by one in which ING will explore other options for its
Asian insurance and investment management businesses. See the
‘Strategy’ chapter in this Annual Report for further elaboration.
ING GROUP FINANCIAL DEVELOPMENTS
Operating conditions were challenging in 2011. The prolonged
weakness of the economic recovery and its impact on local and
capital markets were especially prominent in the fourth quarter.
Despite this difficult context, ING Group’s full-year results improved
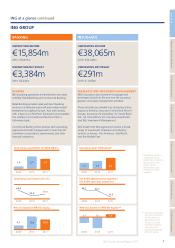
compared with 2010. The full-year 2011 net result was EUR 5,766
million compared with a net result of EUR 2,810 million in 2010.
The2011 net result includes EUR 1,866 million gains on divestments,
of which EUR 995 million was attributable to the sale of our Latin
American insurance, pension and investment management business,
EUR 347 million to the sale of ING Car Lease, and EUR 466 million
tothe sale of Real Estate Investment Management.
Special items were EUR 54 million in 2011 compared with
EUR –1,065 million in 2010. The 2011 special items include a
EUR 716 million net gain from the liability management transaction,
i.e., the exchange or tender offers for seven tranches of
subordinated debt securities totalling approximately EUR 5.8 billion,
offset by costs for various restructuring programmes and separation
costs. Result on divestments and discontinued operations recorded
in 2010 were EUR 683 million. Net gains on divestments were
EUR 388 million, mainly reflecting the result on the sale of Private
Banking Switzerland and Asia. The 2010 net results from divested
units anddiscontinued operations amounted to EUR 296 million
and relate mainly to Insurance Latin America, ING Car Lease and
Real Estate Investment Management.
Underlying net result for 2011 was EUR 3,675 million, up 15.1%
from EUR 3,192 million a year earlier. Underlying net result is
derived from total net result by excluding the impact from
divestments and special items.
ING’s capital position remained strong, despite the EUR 3 billion
repayment to the Dutch State in May 2011. ING Bank’s core Tier 1
ratio was stable at 9.6% at the end of 2011, absorbing the EUR 9
billion higher risk-weighted assets (RWA) under the Capital
Requirements Directive III (CRD III). The Insurance Group Directive
Solvency I ratio decreased to 225% at the end of 2011 from 230%
at the end of 2010. The Group debt/equity ratio decreased to
12.7% as a result of a successful liability management transaction
in December 2011. This transaction generated EUR 716 million net
profit for ING Group.
Shareholders’ equity increased EUR 5.8 billion from EUR 40.9 billion
at the end of 2010 to EUR 46.7 billion at the end of 2011. This
increase was caused by the EUR 5.8 billion net profit. Positive
changes in reserves were offset by the EUR 1 billion repurchase
premium paid to the Dutch State in May 2011. This amount is the
50% premium paid on the repurchase of EUR 2 billion core Tier 1
securities issued in November 2008. Shareholders’ equity per share
was EUR 12.33 at the end of 2011 versus EUR 10.81 at the end of
2010. Underlying net return on equity, calculated as underlying net
result divided by average IFRS-EU equity, improved from 8.1% in
2010 to 8.7% in 2011.
Banking recorded an underlying result before tax of EUR 4,740
million in 2011, a 17.4% decrease compared with 2010. This decrease
was mainly driven by EUR 783 million more adverse market impacts
in 2011, of which EUR 588 million was impairments on Greek
government bonds. Insurance reported an underlying result before
tax of EUR 314 million, which was up EUR 1,386 million compared
with the EUR 1,072 million loss in 2010. Both years were heavily
impacted bymarkets and other impacts, i.e., EUR –1,547 million in
2011 versus EUR –2,567 million in 2010.
IMPORTANT CHANGES IN REGULATION AND SUPERVISION
During 2011 important steps were taken in the European and
international regulatory reform programmes that had been set up
inthe wake of the 2008/2009 financial crisis.
Reforms in the financial sector are of particular interest to ING as
across-border financial institution with operations all over Europe
and in other parts of the world. Although we actively support many
of the new regulatory proposals and are implementing them to a
large extent already, we have strong concerns that the ultimate and
aggregated consequences of all reforms are still not fully clear. We
fear that there are too many uncoordinated additions to regulation;
that there is too much focus on short-term measures, and too little
a focus on how the financial sector can contribute to achieving
sustainable economic growth. This has a number of potential
effects which should be taken into serious consideration.
First, we are concerned that too much regulation will unnecessarily
restrict banking activities needed to support the economy and will
make our services more expensive. Second, because of the
aggregate impact of various new rules a tendency may emerge
inwhich risks that are normally taken by financial institutions are
shifted to customers.
13ING Group Annual Report 2011
Financial and regulatory environment continued