ING Direct 2011 Annual Report Download - page 11
Download and view the complete annual report
Please find page 11 of the 2011 ING Direct annual report below. You can navigate through the pages in the report by either clicking on the pages listed below, or by using the keyword search tool below to find specific information within the annual report.-
 1
1 -
 2
2 -
 3
3 -
 4
4 -
 5
5 -
 6
6 -
 7
7 -
 8
8 -
 9
9 -
 10
10 -
 11
11 -
 12
12 -
 13
13 -
 14
14 -
 15
15 -
 16
16 -
 17
17 -
 18
18 -
 19
19 -
 20
20 -
 21
21 -
 22
22 -
23
-
24
-
25
-
26
-
27
-
28
-
29
-
30
-
31
-
32
-
33
-
34
-
35
-
36
-
37
-
38
-
39
-
40
-
41
-
42
-
43
-
44
-
45
-
46
-
47
-
48
-
49
-
50
-
51
-
52
-
53
-
54
-
55
-
56
-
57
-
58
-
59
-
60
-
61
-
62
-
63
-
64
-
65
-
66
-
67
-
68
-
69
-
70
-
71
-
72
-
73
-
74
-
75
-
76
-
77
-
78
-
79
-
80
-
81
-
82
-
83
-
84
-
85
-
86
-
87
-
88
-
89
-
90
-
91
-
92
-
93
-
94
-
95
-
96
-
97
-
98
-
99
-
100
-
101
-
102
-
103
-
104
-
105
-
106
-
107
-
108
-
109
-
110
-
111
-
112
-
113
-
114
-
115
-
116
-
117
-
118
-
119
-
120
-
121
-
122
-
123
-
124
-
125
-
126
-
127
-
128
-
129
-
130
-
131
-
132
-
133
-
134
-
135
-
136
-
137
-
138
-
139
-
140
-
141
-
142
-
143
-
144
-
145
-
146
-
147
-
148
-
149
-
150
-
151
-
152
-
153
-
154
-
155
-
156
-
157
-
158
-
159
-
160
-
161
-
162
-
163
-
164
-
165
-
166
-
167
-
168
-
169
-
170
-
171
-
172
-
173
-
174
-
175
-
176
-
177
-
178
-
179
-
180
-
181
-
182
-
183
-
184
-
185
-
186
-
187
-
188
-
189
-
190
-
191
-
192
-
193
-
194
-
195
-
196
-
197
-
198
-
199
-
200
-
201
-
202
-
203
-
204
-
205
-
206
-
207
-
208
-
209
-
210
-
211
-
212
-
213
-
214
-
215
-
216
-
217
-
218
-
219
-
220
-
221
-
222
-
223
-
224
-
225
-
226
-
227
-
228
-
229
-
230
-
231
-
232
-
233
-
234
-
235
-
236
-
237
-
238
-
239
-
240
-
241
-
242
-
243
-
244
-
245
-
246
-
247
-
248
-
249
-
250
-
251
-
252
-
253
-
254
-
255
-
256
-
257
-
258
-
259
-
260
-
261
-
262
-
263
-
264
-
265
-
266
-
267
-
268
-
269
-
270
-
271
-
272
-
273
-
274
-
275
-
276
-
277
-
278
-
279
-
280
-
281
-
282
-
283
-
284
-
285
-
286
-
287
-
288
-
289
-
290
-
291
-
292
-
293
-
294
-
295
-
296
-
297
-
298
-
299
-
300
-
301
-
302
-
303
-
304
-
305
-
306
-
307
-
308
-
309
-
310
-
311
-
312
-
313
-
314
-
315
-
316
-
317
-
318
-
319
-
320
-
321
-
322
-
323
-
324
-
325
-
326
-
327
-
328
-
329
-
330
-
331
-
332
 |
 |

ING Group
in accordance with IFRS-EU
in EUR million unless otherwise indicated 2011 2010 (1) 2009 (1) 2008 (1) 2007 (1)
Income
Banking operations 17,908 17,73 4 12,293 11,662 14,602
Insurance operations 38,236 36,708 34,971 52,877 59,293
Intercompany eliminations 350 337 336 291 223
Total 55,794 54,105 46,928 64,248 73,672
Staff expenses and operating expenses
Banking operations 9,889 9,659 9,665 10,122 9,970
Insurance operations 4,132 4,109 4,199 5,117 5,035
Total 14,021 13,768 13,864 15,239 15,005
Addition to loan loss provision Banking operations 1,670 1,751 2,973 1,280 125
Result
Banking result before taxation 6,028 5,830 –838 106 4,510
Insurance result before taxation 81 –1,902 –999 –1,855 6,366
Result before taxation from continuing operations 6,109 3,928 –1,837 –1,749 10,876
Taxation 1,365 1,228 – 613 –762 1,460
Net result from discontinued operations (2) 1,109 216 100 82 89
Minority interests 87 106 –118 –37 267
Net result 5,766 2,810 –1,006 –868 9,238
Figures per ordinary share (in EUR)
Basic earnings (3) 1.12 0.63 –0.60 –0.33 3.31
Shareholders’ equity (in parent) 12.33 10.81 8.89 8.55 17.73
Balance sheet (year-end, in EUR billion)
Total assets 1,279 1,247 1,164 1,332 1,313
Shareholders’ equity (in parent) 47 41 34 17 37
Core Tier1 securities 35510
(1) The figures of this period have been restated to reflect the change in accounting policy, i.e., the move towards fair value accounting
for Guaranteed Minimum Withdrawal Benefits for life in the US Closed Block VA as of 1 January 2011.
(2) The net result of Latin America has been transferred to ‘net result from discontinued operations’. The years 2010 and 2009 have been restated.
(3) See note 49 in the Annual Accounts.
Capital ratios and other data
2011 2010 2009
Debt/equity ratio (1) 12.7% 13.4% 12.4%
Core Tier 1 ratio 9.6% 9.6% 7.8%
Insurance IGD Solvency I ratio (2) 225% 230% n.a.
Underlying return on equity based on IFRS-EU equity 8.7% 8.1% 3.3%
Employees (FTEs, year-end, adjusted for divestments) 97,043 97,832 96,836
Market capitalisation (in EUR billion) 21 28 26
(1) ING Group evaluates its debt/equity ratio on the basis of ‘core debt’ and ‘adjusted equity’.
Further information is provided in the section ‘Capital management’ in the consolidated annual accounts.
(2) The calculation of the IGD ratio was changed in the fourth quarter of 2011 to ensure consistent application throughout the Group; only the comparative
2010 ratio was adjusted.
ING Group evaluates the results of its businesses using a non-GAAP financial performance measure called underlying result. Underlying
result is derived from the result in accordance with IFRS-EU by excluding the impact of divestments and special items. Historic results
havebeen restated for divestments in order to create a comparable sequence (i.e. 2011, 2010 and 2009 results exclude the results
ofadivestment which was completed in 2011). See note 51 in the consolidated annual accounts for a reconciliation between IFRS
andunderlying result.
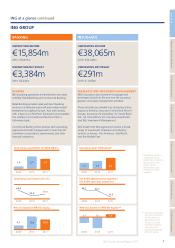
Underlying net result
in EUR million 2011 2010 % change 2009
Banking operations 3,384 4,242 –20.2% 1,128
Insurance operations 291 –1,050 –432
Underlying net result 3,675 3,192 15.1% 696
Divestments, discontinued operations and special items 2,091 –382 –1,702
Net result 5,766 2,810 105.2% –1,006
9ING Group Annual Report 2011
Key figures
1 Who we are 2 Report of the Executive Board 3 Corporate governance 4 Consolidated annual accounts 5 Parent company annual accounts 6 Other information 7 Additional information